
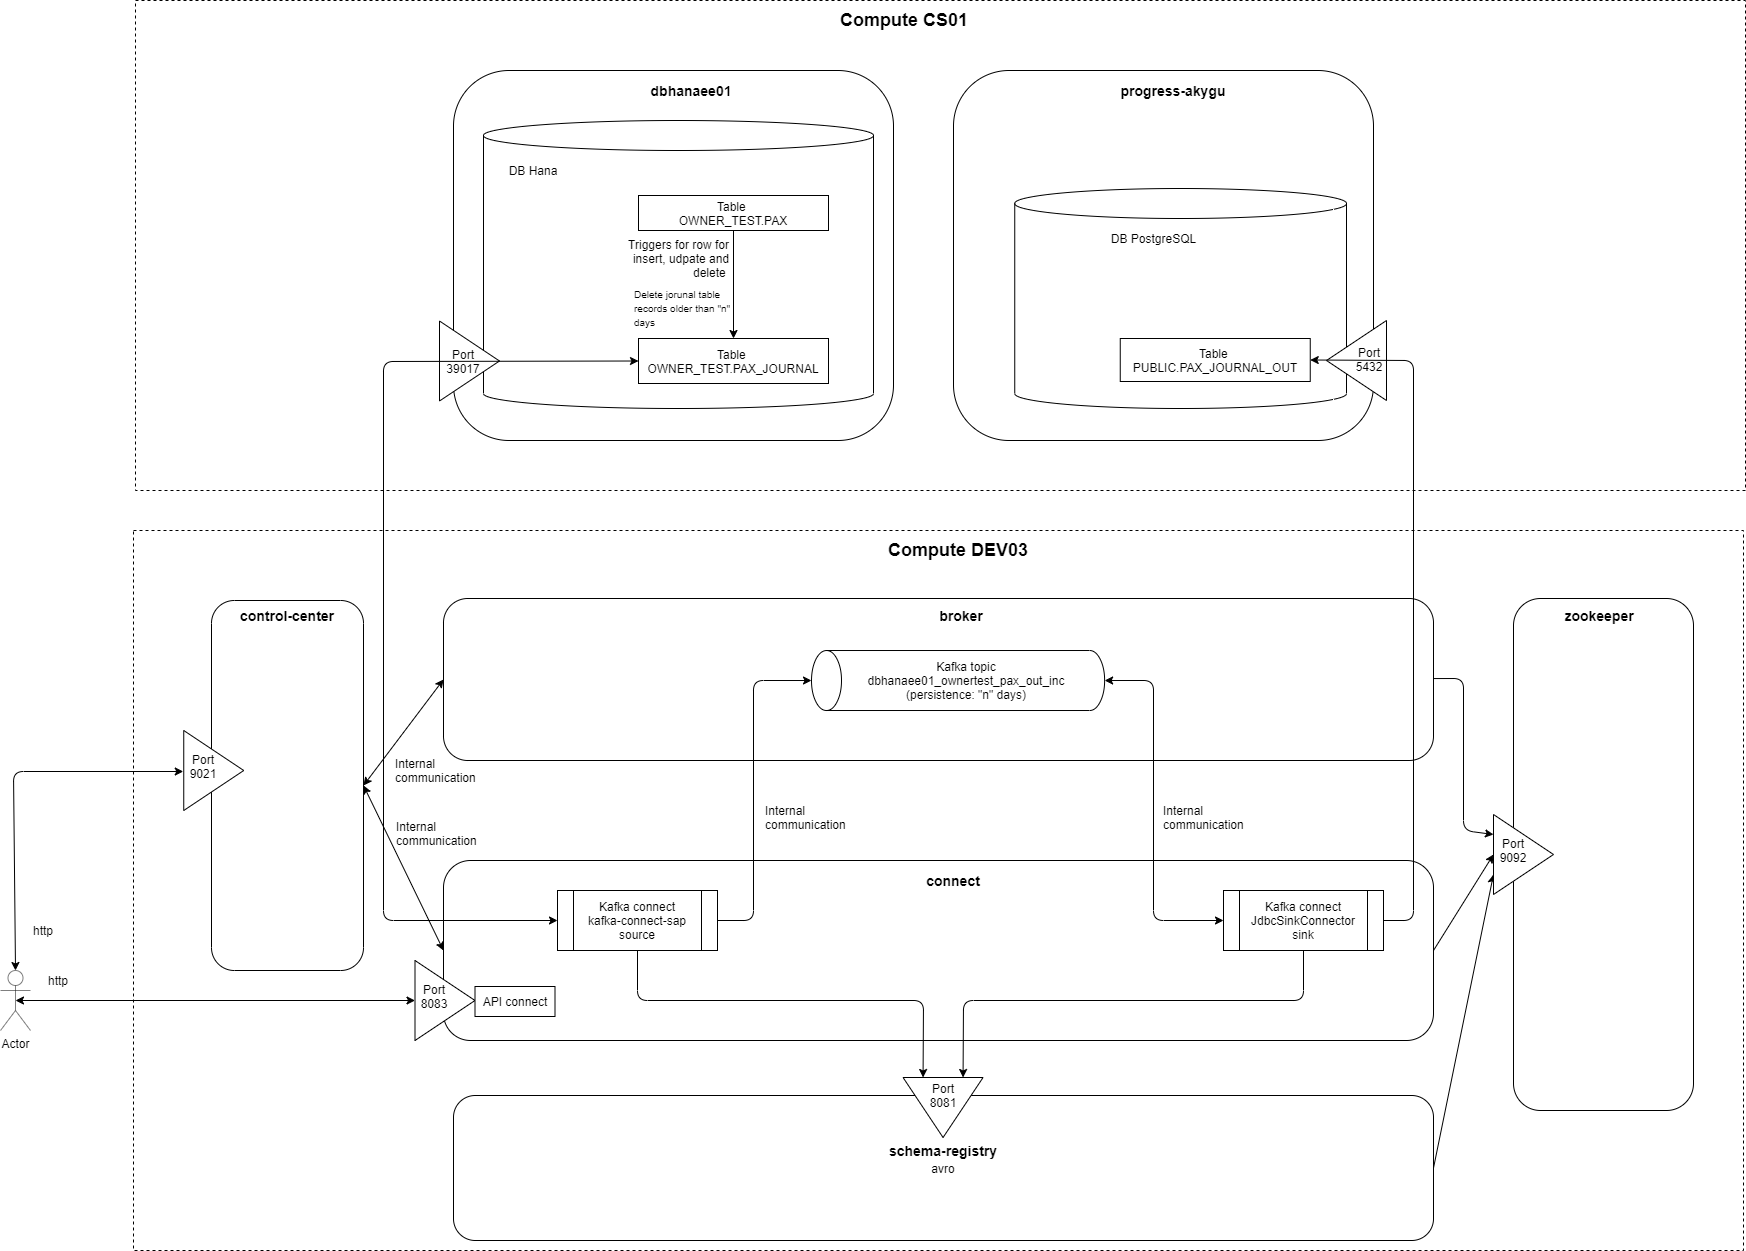
This entry details the implementation of a CDC (change data capture) of a Hana database table using triggers at the source database layer to identify the insert, update, and delete changes to that table that are logged during "n" hours (maximum stop period of the CDC process at any of its points and that must match the persistence of messages in the topic) in a journal table , and using the kafka-connect-sap connector as the topic source category connector (a topic source is a message producer for the topic) in incremental mode to monitor every "x" milliseconds in the journal table and send all new records incrementally to the kafka topic that is consumed by a sink category connector (a sink connector is a message-consuming connector of a topic) kafka-connect-jdbc (JdbcSinkConnector) that inserts it into a PostgreSQL database where a subsequent trigger-based process digests this data and leaves it in a table identical to the original existing one in the Hana database.
The kafka-connect-sap connector in this example is used as a source to identify table changes in database Hana and send them to a topic, but this connect can be used as any connector also as a sink to consume from a topic and record the information in a Hana database table. In addition, this example uses the kafka-connect-sap connector in incremental working mode where it detects changes from a primary key or unique key functional type column, but also has a working mode in bulk mode, which default mode, which keeps the records in the source table globally at the periodicity that is marked on the connector.
I'm not a Hana database expert and I'm sure there are other ways to implement solutions like this with other tables, but I found it the simplest and safest way to perform CDC without products like SAP Landscape for SAP solutions, and to have the CDC source decoupled from the cdc's destination of the CDC process. In the end, I detail the maintenance operations according to situations where you see the full operational capacity of this solution with a total decoupling between the two databases. I also detail at the end the workload achieved with a 0% error with the one below used:
* CS01 computer: Virtual Box virtual machine with CentOS 8 and 14 GB GB of RAM and 2 CPUs on an Asus R510v host laptop with Intel Core i7-6700HQ ta 3.5 GHz and with 24 GB RAM.
* dev03 computer: HP Probook6550b Notebook with Ubuntu 10.04 and 8GB RAM with intel core i5 CPU.
* Client computer used to call connectors Confluent Kafka API through REST requests, access to Confluent Kafka enterprise console, and run load tests with Apache JMeter 3.2 with JDK 1.8.
Solution architecture schema that I detail in this entry:
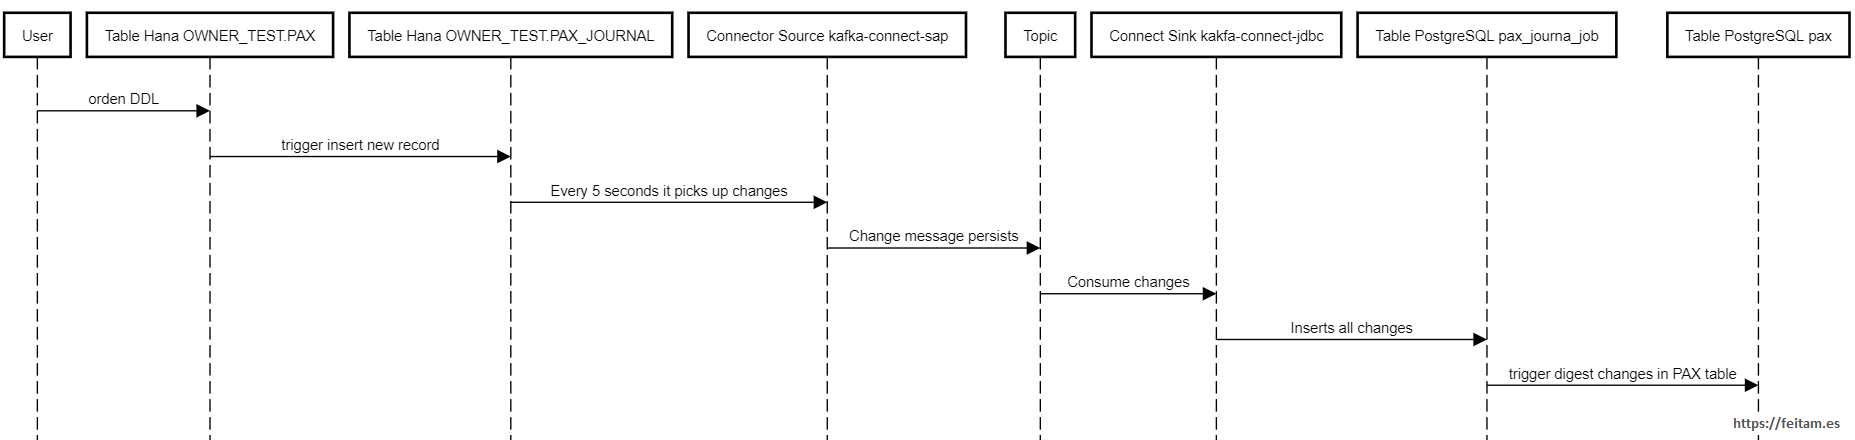
Sequence diagram of a transmission of a change:
The triggers themselves manage the deletion of records in the journal table with an older age of "n" hours. The topic should have an equal persisence these "n" hours, and these "n" hours is the maximum possible stop duration of the entire CDC system. The example has been set 4 days: 96 hours.
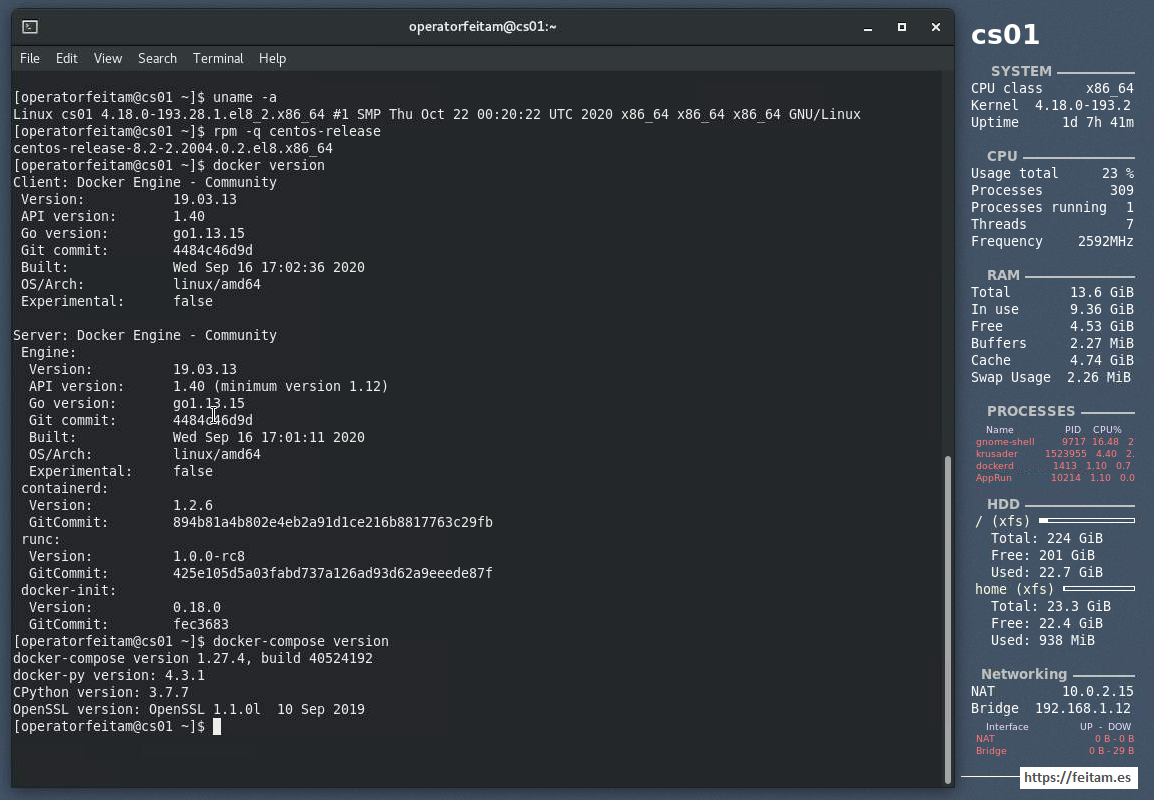
As I detailed earlier for this example I am using a virtual machine managed with VirtualBox named CS01 that has 14 GB of RAM on a CentOS 8 linux, with the following versions of docker community 19.03.13 and docker-compose 1.27.4, all the detail being as follows:
On this CS01 machine you have the following docker-compose configuration file in version 3.1 format where you define a 'postgres' container, an 'adminer' container to manage this PostgreSQL database, and a 'dbhanaee01' container with a Hana Express Edition version 2 database in a file named databases.yml:
version: '3.1'

services:

  db:
    image: postgres:latest
    container_name: postgres_akygu
    restart: always
    ports:
      - "5432:5432"
    environment:
      POSTGRES_PASSWORD: peazopassword
    volumes:
      - ./volumes/postgres/data:/var/lib/postgresql/data
      - ./volumes/postgres/conf/postgres.conf:/usr/local/etc/postgres/postgres.conf
    command: postgres -c config_file=/usr/local/etc/postgres/postgres.conf -c log_statement=all -c logging_collector=on

  adminer:
    image: adminer
    container_name: adminer_akygu
    restart: always
    ports:
      - 8080:8080

  dbhanaee01:
    image: store/saplabs/hanaexpress:2.00.045.00.20200121.1
    container_name: dbhanaee01
    hostname: dbhanaee01
    command: ['--passwords-url', 'file:////hana/mounts/dbhanaee01_mp.json', '--agree-to-sap-license']
    ulimits:
      nofile: 1048576
    sysctls:
      - kernel.shmmax=1073741824
      - net.ipv4.ip_local_port_range=40000 60999
      - kernel.shmmni=4096
      - kernel.shmall=8388608
    volumes:
      - /workspaces/feitam/akygu/docker/volumes/dbhanaee01:/hana/mounts
    ports:
      - 39013:39013
      - 39017:39017
      - 39041-39045:39041-39045
      - 1128-1129:1128-1129
      - 59013-59014:59013-59014
Both PostgreSQL and Hana databases have defined volumes where data persists in the case of PostgreSQL, and data and configuration in the case of the Hana database, specifically in the ./volumes/postgres/data paths for the data and ./volumes/postgres/conf/posgres.conf for the PostgreSQL configuration file, and in /worksapces/feitam/akygu/docker/volumes/dbhanaee01 for Hana database data and configuration. PostgreSQL volumes use the point indicating that it is a referenced path to running the docker-compose comate that I detail later.
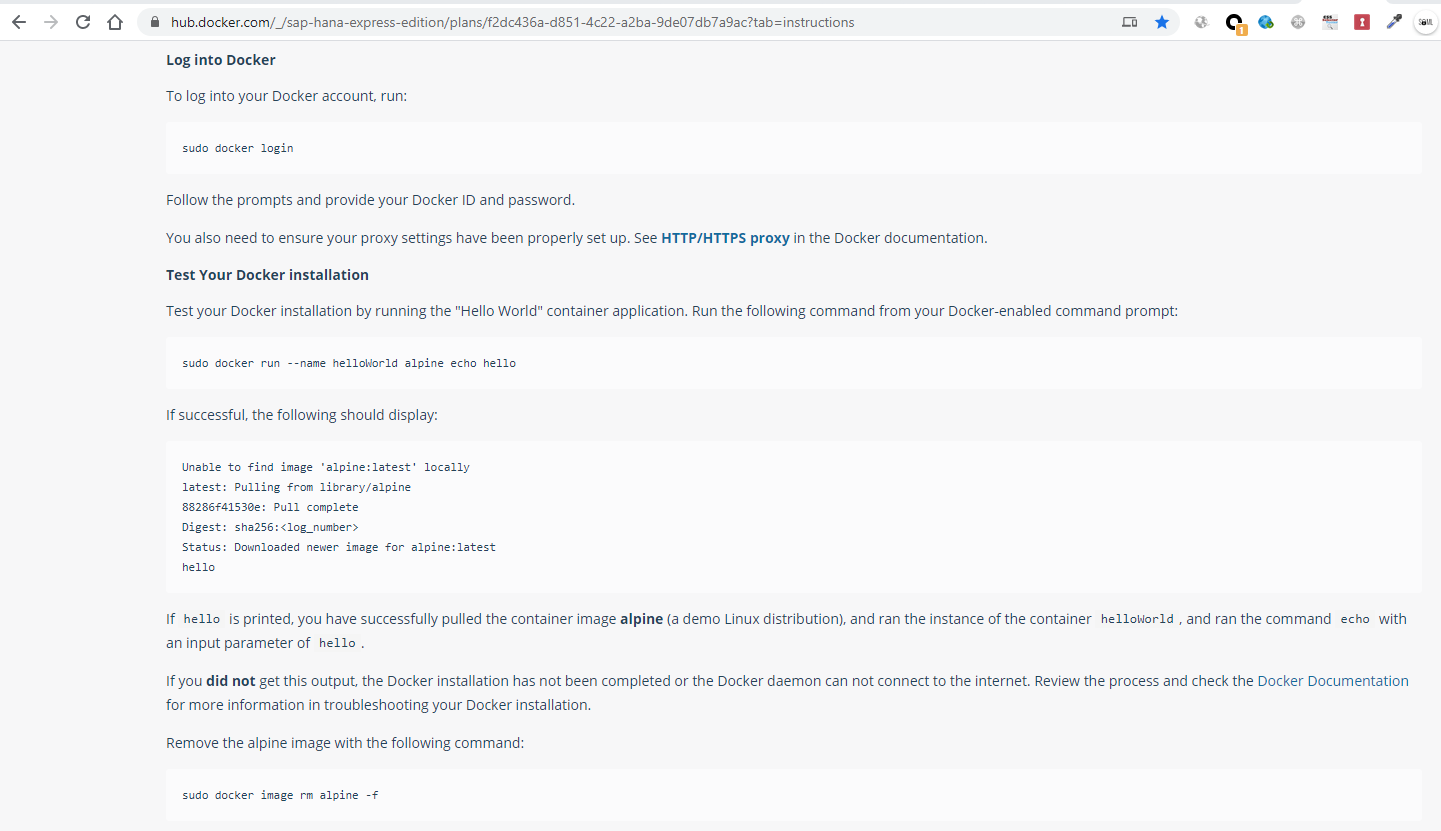
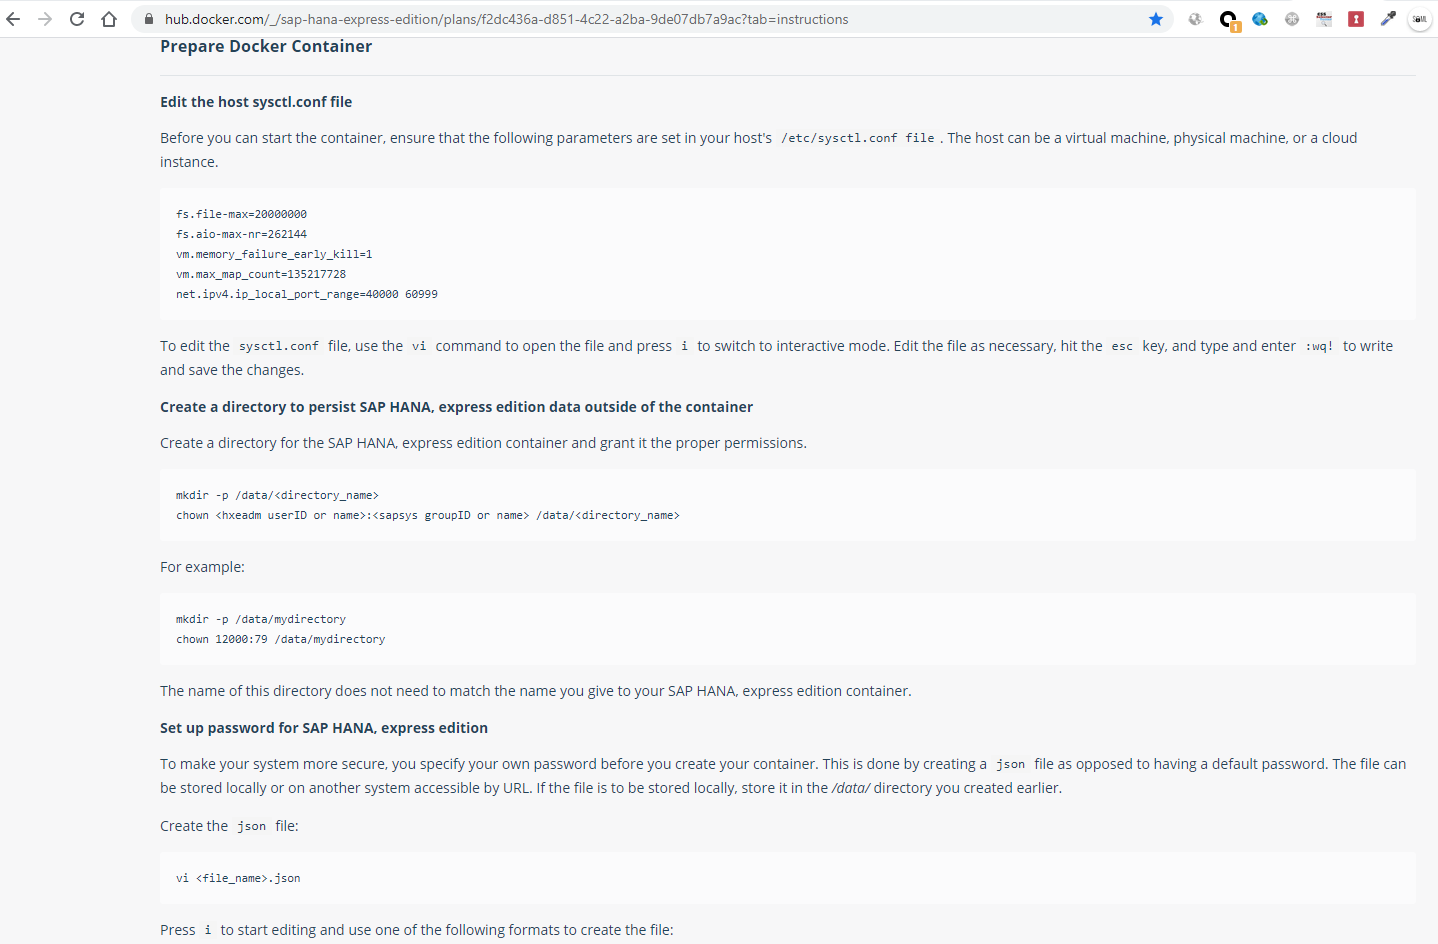
Running the Hana database requires configuring the host server where docker or docker-compose is located as detailed in https://www.sap.com/cmp/td/sap-hana-express-edition.html where we are required to register and let us download the Hana base image for linux and windows, although I downloaded it from Docker Hub at the following URL https://hub.docker.com/_/sap-hana-express-edition/plans/f2dc436a-d851-4c22-a2ba-9de07db7a9ac?tab=instructions where the details of the configuration that we have to perform on the server running docker or docker-compose appear. This example does not give you the same as a dockerized database or a legacy service. A screenshot showing on this page regarding the commented 'docker login':
The configurations that you specify on the anti-cool server must be made before it is run:

And it details how to run it with docker for the first time:
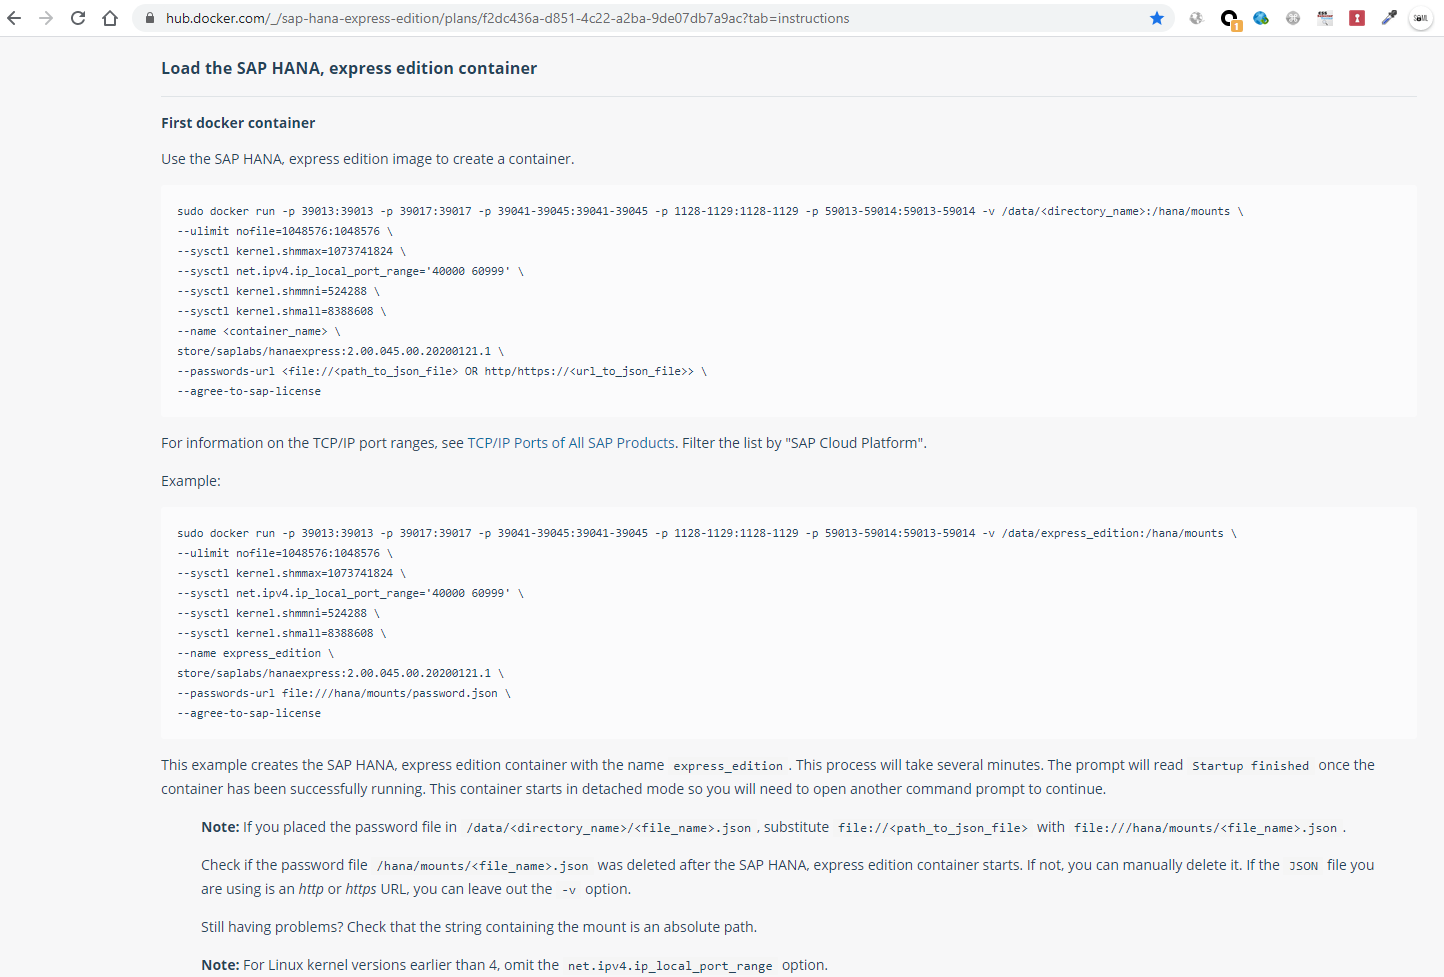
Saying that on the previous page it is reported that it is certified to work on a CentOS 7 but I am running it on a CentOS 8 with docker-compose smoothly... For now.
The Hana Express Edition database image version I am using is store/saplabs/hanaexpress:2.00.045.00.20200121.1, and it is required to run 'docker login' before I can download it as detailed above. Once we have lowered the image with the docker execution specified on the hub.docker.com page, we can verify that we have the Database Hana image and the others by running the command:
docker images
that brings us back:
[operatorfeitam@cs01 ~]$ docker images
REPOSITORY                                      TAG                      IMAGE ID            CREATED             SIZE
adminer                                         latest                   476c78d02a95        6 weeks ago         89.9MB
postgres                                        latest                   c96f8b6bc0d9        2 months ago        314MB
store/saplabs/hanaexpress                       2.00.045.00.20200121.1   aeb6e1b699dc        11 months ago       3.58GB
[operatorfeitam@cs01 ~]$
If they are not they will be lowered when running docker-compose, but the Hana database the important thing is that it requires login and that is why it is advisable to have it lowered.
To run with docker compose the two databases we position ourselves in the folder where we have the databases.yml file and run:
docker-compose -f databases.yml up
To stop it can be done incorrectly with a 'Ctrl+C' or correctly by running on another console by locating in the path of the databases.yml file the command:
docker-compose -f databases.yml down
After running 'docker.compose -f databases.yml up' on another console I run the following command to view the dockers container usage statistics:
docker stats
It shows the following information where you can see that the three containers are running:

Once we have the two databases running we connect to both to create the necessary objects.
To connect I use the DBeaver version 7.2.1 app, which I recommend for being able to connect to multiple databases through JDBC with the ease that the app goes down the drivers for each database on its own.
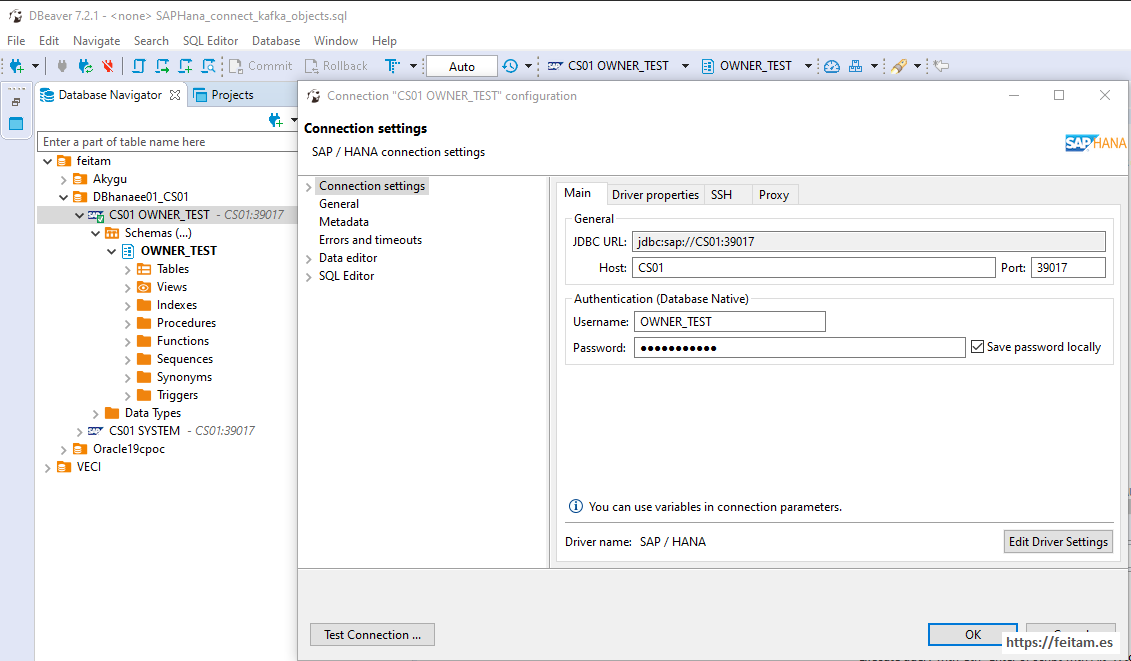
I copy the connection settings for the Hana database, the source of the information we are going to replicate, named CS01, specify the JDBC URL, the host name that is the Virtual Box CS01 machine, and the port, plus the user and password (DBeaver driver will be lowered the first time it is used informing the user) , using the OWNER_TEST:
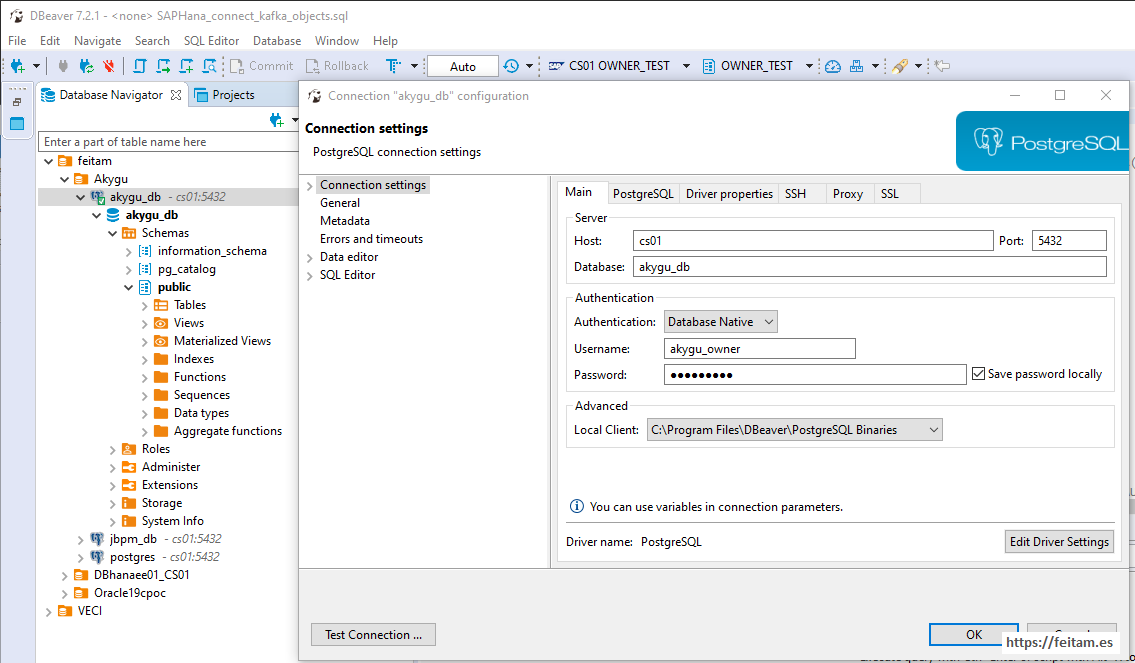
And then the connection for the PostgreSQL database, the destination of the information that we want to replicate, and which is called akygu_db the instance, located in akygu_db container of the Virtual Box CS01 machine, and the schema used is akygu_owner:
In the database named CS01 of the dbhanaee01 container we will create, in this example, in the schema OWNER_TEST the PAX and PAX_JOURNAL. The PAX_JOURNAL table will record all insert, update, or delete changes that occur in the PAX table, and this will be done from three triggers that before each change record the new record in the insert and update changes in table PAX_JOURNAL, and the delete record in the delete type changes. The script for creating these objects in the schema ONWER_TEST the Hana dbhanaee01 database on CS01 is as follows:
CREATE COLUMN TABLE "OWNER_TEST"."PAX_JOURNAL" ("ID_JOURNAL" INTEGER CS_INT GENERATED BY DEFAULT AS IDENTITY, "ACTION_JOURNAL" VARCHAR(1), "TIMESTAMP_JOURNAL" LONGDATE CS_LONGDATE, "ID" INTEGER CS_INT, "NAME" VARCHAR(64), PRIMARY KEY

CREATE COLUMN TABLE "OWNER_TEST"."PAX" ("ID" INTEGER CS_INT GENERATED BY DEFAULT AS IDENTITY, "NAME" VARCHAR(64), PRIMARY KEY ("ID")) UNLOAD PRIORITY 5 AUTO MERGE ;

CREATE TRIGGER "OWNER_TEST"."TRG_PAX_AFTER_ROW_UPDATE" AFTER
UPDATE
    ON
    "OWNER_TEST"."PAX" REFERENCING NEW ROW NEW FOR EACH ROW
BEGIN
        INSERT
    INTO
    PAX_JOURNAL (ACTION_JOURNAL, TIMESTAMP_JOURNAL, ID, NAME)
VALUES ('U', CURRENT_TIMESTAMP, :NEW.ID, :NEW.NAME);

DELETE
FROM
    PAX_JOURNAL
WHERE
    TIMESTAMP_JOURNAL < ADD_DAYS(NOW(), -4);
END;

CREATE TRIGGER "OWNER_TEST"."TRG_PAX_AFTER_ROW_DELETE" AFTER
DELETE
    ON
    "OWNER_TEST"."PAX" REFERENCING OLD ROW OLD FOR EACH ROW
BEGIN
        INSERT
    INTO
    PAX_JOURNAL (ACTION_JOURNAL, TIMESTAMP_JOURNAL, ID, NAME)
VALUES ('D', CURRENT_TIMESTAMP, :OLD.ID, :OLD.NAME);

DELETE
FROM
    PAX_JOURNAL
WHERE
    TIMESTAMP_JOURNAL < ADD_DAYS(NOW(), -4);
END;

CREATE TRIGGER "OWNER_TEST"."TRG_PAX_AFTER_ROW_INSERT" AFTER
INSERT
    ON
    "OWNER_TEST"."PAX" REFERENCING NEW ROW NEW FOR EACH ROW
BEGIN
        INSERT
    INTO
    PAX_JOURNAL (ACTION_JOURNAL, TIMESTAMP_JOURNAL, ID, NAME)
VALUES ('I', CURRENT_TIMESTAMP, :NEW.ID, :NEW.NAME);

DELETE
FROM
    PAX_JOURNAL
WHERE
    TIMESTAMP_JOURNAL < ADD_DAYS(NOW(), -4);
END;
And in the akygu_db database, in schema akygu_owner we create the target table of all pax_journal_out changes and final pax table whose data will be generated from triggers from the pax_journal_out table. It could be done with a process of digesting the information that is received in pax_journal_out not based on triggers, but in this example it is in triggers to have the changes as new logs are received:
CREATE TABLE public.pax (
	ID int4 NULL,
	NAME text NULL,
	CONSTRAINT pax_pkey PRIMARY KEY (ID)
);

CREATE TABLE public.pax_journal_out (
	"ID_JOURNAL" int4 NOT NULL,
	"ACTION_JOURNAL" text NULL,
	"TIMESTAMP_JOURNAL" timestamp NULL,
	"ID" int4 NULL,
	"NAME" text NULL,
	CONSTRAINT pax_journal_out_pkey PRIMARY KEY ("ID_JOURNAL")
);

CREATE FUNCTION digest_pax_journal_out() RETURNS trigger AS $digest_pax_journal_out$
    BEGIN

        IF (NEW."ACTION_JOURNAL" = 'I') THEN
            insert into public.pax (id, name) values (new."ID", new."NAME");
        ELSE
          IF (NEW."ACTION_JOURNAL" = 'U') THEN
            update public.pax
            set
            name = new."NAME"
            where
            id = new."ID";
          ELSE
            IF (NEW."ACTION_JOURNAL" = 'D') THEN
              delete from public.pax
              where
              id = new."ID";
            END IF;
          END IF;
        END IF;

        RETURN NEW;
    END;
$digest_pax_journal_out$ LANGUAGE plpgsql;

CREATE TRIGGER tgr_pax_journal_out_after_row_insert AFTER INSERT ON public.pax_journal_out
    FOR EACH ROW EXECUTE PROCEDURE digest_pax_journal_out();
Since we have everything about databases running, let's mount the integration using Confluent Kafka. For which you can get off or use from https://www.confluent.io/download any type of deployment of the Confluent Kafka solution. I in this example run it with docker-compose using the following yml file that I have dropped from an option called "cp-all-in-one" on the Confluent page with the princiaples components of the entire Confluent kafka product stack. This option allows you to use the comunity version and the enterprise. In this example I use the enterprise that carries the control-center that gives us some ability to manage and display connectors, topic and messages without using the API to be able to teach it. Actually with the comunity version we would have enough to require only the broker, zookeeper, schema-registry and a connector for this CDC case. As information the comunity also carries the rest-proxy, ksql-datagen, ksqldb-cli and ksqldb-server in addition.
In my blog post First steps with Kafka Connect HTTP Sink: installation, configuration, errors manager and monitoring detail the functionalities of most of these Confluent Kafka components.The yml file that I use to boot Confluent Kafka with docker composese calls confluent_kafka.yml and has the following content:
---
version: '2'
services:
  zookeeper:
    image: confluentinc/cp-zookeeper:6.0.1
    hostname: zookeeper
    container_name: zookeeper
    restart: always
    ports:
      - "2181:2181"
    environment:
      ZOOKEEPER_CLIENT_PORT: 2181
      ZOOKEEPER_TICK_TIME: 2000

  broker:
    image: confluentinc/cp-server:6.0.1
    hostname: broker
    container_name: broker
    restart: always
    depends_on:
      - zookeeper
    ports:
      - "9092:9092"
      - "9101:9101"
    environment:
      KAFKA_BROKER_ID: 1
      KAFKA_ZOOKEEPER_CONNECT: 'zookeeper:2181'
      KAFKA_LISTENER_SECURITY_PROTOCOL_MAP: PLAINTEXT:PLAINTEXT,PLAINTEXT_HOST:PLAINTEXT
      KAFKA_ADVERTISED_LISTENERS: PLAINTEXT://broker:29092,PLAINTEXT_HOST://localhost:9092
      KAFKA_METRIC_REPORTERS: io.confluent.metrics.reporter.ConfluentMetricsReporter
      KAFKA_OFFSETS_TOPIC_REPLICATION_FACTOR: 1
      KAFKA_GROUP_INITIAL_REBALANCE_DELAY_MS: 0
      KAFKA_CONFLUENT_LICENSE_TOPIC_REPLICATION_FACTOR: 1
      KAFKA_CONFLUENT_BALANCER_TOPIC_REPLICATION_FACTOR: 1
      KAFKA_TRANSACTION_STATE_LOG_MIN_ISR: 1
      KAFKA_TRANSACTION_STATE_LOG_REPLICATION_FACTOR: 1
      KAFKA_JMX_PORT: 9101
      KAFKA_JMX_HOSTNAME: localhost
      KAFKA_CONFLUENT_SCHEMA_REGISTRY_URL: http://schema-registry:8081
      CONFLUENT_METRICS_REPORTER_BOOTSTRAP_SERVERS: broker:29092
      CONFLUENT_METRICS_REPORTER_TOPIC_REPLICAS: 1
      CONFLUENT_METRICS_ENABLE: 'true'
      CONFLUENT_SUPPORT_CUSTOMER_ID: 'anonymous'

  schema-registry:
    image: confluentinc/cp-schema-registry:6.0.1
    hostname: schema-registry
    container_name: schema-registry
    restart: always
    depends_on:
      - broker
    ports:
      - "8081:8081"
    environment:
      SCHEMA_REGISTRY_HOST_NAME: schema-registry
      SCHEMA_REGISTRY_KAFKASTORE_BOOTSTRAP_SERVERS: 'broker:29092'
      SCHEMA_REGISTRY_LISTENERS: http://0.0.0.0:8081

  connect:
    #image: cnfldemos/cp-server-connect-datagen:0.4.0-6.0.1
    #image: cnfldemos/cp-server-connect-datagen:0.3.2-5.5.0
    image: connect-cdc-hana:1.0.0
    hostname: connect
    container_name: connect
    restart: always
    depends_on:
      - broker
      - schema-registry
    ports:
      - "8083:8083"
    environment:
      CONNECT_BOOTSTRAP_SERVERS: 'broker:29092'
      CONNECT_REST_ADVERTISED_HOST_NAME: connect
      CONNECT_REST_PORT: 8083
      CONNECT_GROUP_ID: compose-connect-group
      CONNECT_CONFIG_STORAGE_TOPIC: docker-connect-configs
      CONNECT_CONFIG_STORAGE_REPLICATION_FACTOR: 1
      CONNECT_OFFSET_FLUSH_INTERVAL_MS: 10000
      CONNECT_OFFSET_STORAGE_TOPIC: docker-connect-offsets
      CONNECT_OFFSET_STORAGE_REPLICATION_FACTOR: 1
      CONNECT_STATUS_STORAGE_TOPIC: docker-connect-status
      CONNECT_STATUS_STORAGE_REPLICATION_FACTOR: 1
      CONNECT_KEY_CONVERTER: org.apache.kafka.connect.storage.StringConverter
      CONNECT_VALUE_CONVERTER: io.confluent.connect.avro.AvroConverter
      CONNECT_VALUE_CONVERTER_SCHEMA_REGISTRY_URL: http://schema-registry:8081
      CONNECT_INTERNAL_KEY_CONVERTER: "org.apache.kafka.connect.json.JsonConverter"
      CONNECT_INTERNAL_VALUE_CONVERTER: "org.apache.kafka.connect.json.JsonConverter"
      # CLASSPATH required due to CC-2422
      CLASSPATH: /usr/share/java/monitoring-interceptors/monitoring-interceptors-6.0.1.jar
      CONNECT_PRODUCER_INTERCEPTOR_CLASSES: "io.confluent.monitoring.clients.interceptor.MonitoringProducerInterceptor"
      CONNECT_CONSUMER_INTERCEPTOR_CLASSES: "io.confluent.monitoring.clients.interceptor.MonitoringConsumerInterceptor"
      CONNECT_PLUGIN_PATH: "/usr/share/java,/usr/share/confluent-hub-components,/opt"
      CONNECT_LOG4J_LOGGERS: org.apache.zookeeper=ERROR,org.I0Itec.zkclient=ERROR,org.reflections=ERROR
    # FOR kafka-connect-sap and ngdbc.jar
    volumes:
      - /data/docker_connect/confluent-hub-components/:/opt

  control-center:
    image: confluentinc/cp-enterprise-control-center:6.0.1
    hostname: control-center
    container_name: control-center
    restart: always
    depends_on:
      - broker
      - schema-registry
      - connect
      - ksqldb-server
    ports:
      - "9021:9021"
    environment:
      CONTROL_CENTER_BOOTSTRAP_SERVERS: 'broker:29092'
      CONTROL_CENTER_CONNECT_CLUSTER: 'connect:8083'
      CONTROL_CENTER_KSQL_KSQLDB1_URL: "http://ksqldb-server:8088"
      CONTROL_CENTER_KSQL_KSQLDB1_ADVERTISED_URL: "http://localhost:8088"
      CONTROL_CENTER_SCHEMA_REGISTRY_URL: "http://schema-registry:8081"
      CONTROL_CENTER_REPLICATION_FACTOR: 1
      CONTROL_CENTER_INTERNAL_TOPICS_PARTITIONS: 1
      CONTROL_CENTER_MONITORING_INTERCEPTOR_TOPIC_PARTITIONS: 1
      CONFLUENT_METRICS_TOPIC_REPLICATION: 1
      PORT: 9021

  ksqldb-server:
    image: confluentinc/cp-ksqldb-server:6.0.1
    hostname: ksqldb-server
    container_name: ksqldb-server
    restart: always
    depends_on:
      - broker
      - connect
    ports:
      - "8088:8088"
    environment:
      KSQL_CONFIG_DIR: "/etc/ksql"
      KSQL_BOOTSTRAP_SERVERS: "broker:29092"
      KSQL_HOST_NAME: ksqldb-server
      KSQL_LISTENERS: "http://0.0.0.0:8088"
      KSQL_CACHE_MAX_BYTES_BUFFERING: 0
      KSQL_KSQL_SCHEMA_REGISTRY_URL: "http://schema-registry:8081"
      KSQL_PRODUCER_INTERCEPTOR_CLASSES: "io.confluent.monitoring.clients.interceptor.MonitoringProducerInterceptor"
      KSQL_CONSUMER_INTERCEPTOR_CLASSES: "io.confluent.monitoring.clients.interceptor.MonitoringConsumerInterceptor"
      KSQL_KSQL_CONNECT_URL: "http://connect:8083"
      KSQL_KSQL_LOGGING_PROCESSING_TOPIC_REPLICATION_FACTOR: 1
      KSQL_KSQL_LOGGING_PROCESSING_TOPIC_AUTO_CREATE: 'true'
      KSQL_KSQL_LOGGING_PROCESSING_STREAM_AUTO_CREATE: 'true'

  ksqldb-cli:
    image: confluentinc/cp-ksqldb-cli:6.0.1
    container_name: ksqldb-cli
    restart: always
    depends_on:
      - broker
      - connect
      - ksqldb-server
    entrypoint: /bin/sh
    tty: true

  ksql-datagen:
    image: confluentinc/ksqldb-examples:6.0.1
    hostname: ksql-datagen
    restart: always
    container_name: ksql-datagen
    depends_on:
      - ksqldb-server
      - broker
      - schema-registry
      - connect
    command: "bash -c 'echo Waiting for Kafka to be ready... && \
                       cub kafka-ready -b broker:29092 1 40 && \
                       echo Waiting for Confluent Schema Registry to be ready... && \
                       cub sr-ready schema-registry 8081 40 && \
                       echo Waiting a few seconds for topic creation to finish... && \
                       sleep 11 && \
                       tail -f /dev/null'"
    environment:
      KSQL_CONFIG_DIR: "/etc/ksql"
      STREAMS_BOOTSTRAP_SERVERS: broker:29092
      STREAMS_SCHEMA_REGISTRY_HOST: schema-registry
      STREAMS_SCHEMA_REGISTRY_PORT: 8081

  rest-proxy:
    image: confluentinc/cp-kafka-rest:6.0.1
    depends_on:
      - broker
      - schema-registry
    ports:
      - 8082:8082
    hostname: rest-proxy
    container_name: rest-proxy
    restart: always
    environment:
      KAFKA_REST_HOST_NAME: rest-proxy
      KAFKA_REST_BOOTSTRAP_SERVERS: 'broker:29092'
      KAFKA_REST_LISTENERS: "http://0.0.0.0:8082"
      KAFKA_REST_SCHEMA_REGISTRY_URL: 'http://schema-registry:8081'
The file is as I downloaded it from Confluent Kafka except for the 'connect' container. The original Confluent Kafka file carries a 'connect' container whose base image is 'cnfldemos/cp-server-connect-datagen:0.4.0-6.0.1' and has some connectors available installed, but it does not have even the JdbcSinkConnector connector that we will use to leave the data received from DB Hana in PostgreSQL database, and it also does not have the kafka-connect-sap connector. What I did for this example is to use the base image 'cnfldemos/cp-server-connect-datagen:0.4.0-6.0.1' to install the two required JdbcSinkConnector and kafka-connect-sap connectors, the first by installing it with the 'confluent-hub' command and the second from the down code of the kafka-connect-sap connector, generating a new image that I have named 'connect-cdc-hana:1.0.0'. We detail all of this below. But it is very important to understand that in this example in a docker image that we deploy in a single docker container we are running two connectors, and in a real deployment I would deploy each connector in a specific image to be able to instantiate as many containers as processing capacity requires both when detecting changes in database Hana and sending those changes to other databases, and being able to adjust in each container its computing and memory needs. I haven't tried it but this convinced that I can have two connectors or more of type source to detect switching in source table by stripping data through views by ranges of ID field values. And if in the case you should send the changes to two different databases it is as easy as implementing the detailed in this example but with two sink connectors, each configured to the corresponding target database.
The first thing we have to do is to run the previous confluent_kafka.yml file with docker-compose with the command we already know (the first time we run it will take a while to download all the images):
docker-compose -f confluent_kafka.yml up
And we also know that it should be stopped with:
docker-compose -f confluent-kafka.yml down
This last command stops all containers and deletes them, not downed docker images.
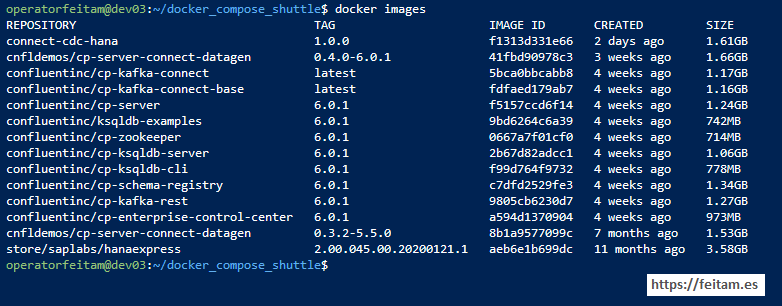
Images that must exist once lowered are all viewed with:
docker images
You should give us the following:
operatorfeitam@dev03:~/docker_compose_shuttle$ docker images
REPOSITORY                                  TAG                      IMAGE ID       CREATED         SIZE
cnfldemos/cp-server-connect-datagen         0.4.0-6.0.1              41fbd90978c3   3 weeks ago     1.66GB
confluentinc/cp-kafka-connect               latest                   5bca0bbcabb8   4 weeks ago     1.17GB
confluentinc/cp-kafka-connect-base          latest                   fdfaed179ab7   4 weeks ago     1.16GB
confluentinc/cp-server                      6.0.1                    f5157ccd6f14   4 weeks ago     1.24GB
confluentinc/ksqldb-examples                6.0.1                    9bd6264c6a39   4 weeks ago     742MB
confluentinc/cp-zookeeper                   6.0.1                    0667a7f01cf0   4 weeks ago     714MB
confluentinc/cp-ksqldb-server               6.0.1                    2b67d82adcc1   4 weeks ago     1.06GB
confluentinc/cp-ksqldb-cli                  6.0.1                    f99d764f9732   4 weeks ago     778MB
confluentinc/cp-schema-registry             6.0.1                    c7dfd2529fe3   4 weeks ago     1.34GB
confluentinc/cp-kafka-rest                  6.0.1                    9805cb6230d7   4 weeks ago     1.27GB
confluentinc/cp-enterprise-control-center   6.0.1                    a594d1370904   4 weeks ago     973MB
cnfldemos/cp-server-connect-datagen         0.3.2-5.5.0              8b1a9577099c   7 months ago    1.53GB
operatorfeitam@dev03:~/docker_compose_shuttle$
While downloading the images on the first run (and following if you give some kind of error or cut the previous run) we will download the kafka-connect-sap connecto from the following Github URL https://github.com/SAP/kafka-connect-sap with:
git clone https://github.com/SAP/kafka-connect-sap.git
When it is on our computers we access the kafka-connect-sap folder created and run the maven command to generate the jar with, but with sudo (this is necessary because the connector directory will be used on a docker volume):
sudo mvn clean install -DskipTests
In my case the kafka-connect-sap folder is in the path /data/docker_connect/confluent-hub-components, and running the above maven command creates a 'target' folder inside kafka-connect-sap with the connector jar that in me almost I have not changed anything from the pom.xml of kafka-connect-sap that I downloaded from Github has created me a kafka-connector-hana-0.9.0-SNAPSHOT file.jar.
In this target folder, add the ngdbc.jar file from the JDBC driver of the Hana database on the SAP page or from any other reliable repository such as the Maven Repository https://mvnrepository.com/artifact/com.sap.cloud.db.jdbc/ngdbc
The 'target' directory in my case already looks like this with the ngdc.jar file (very important: from the root):
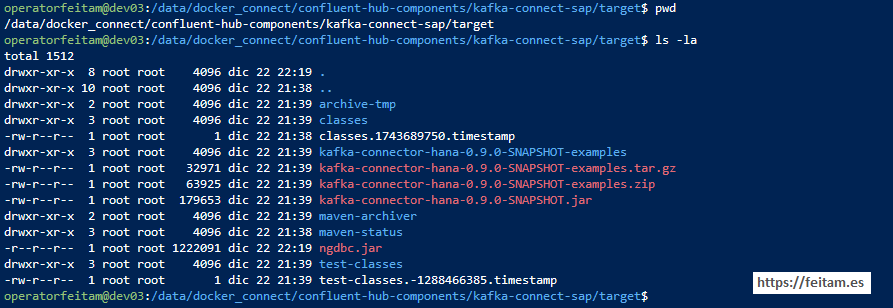
Remember that each time you run the 'mvn clean install -DskipTests' command when you have the 'clean' option regenerates the target directory and the ngdbc file.jar it must be copied again.
Kafka like any product has its versions and its compatibility and incompatibilities. As we have so far if you look at the pom.xml file of kafka-connect-sap we see that it uses kafka version 2.4.1 and scala version 2.12.11:
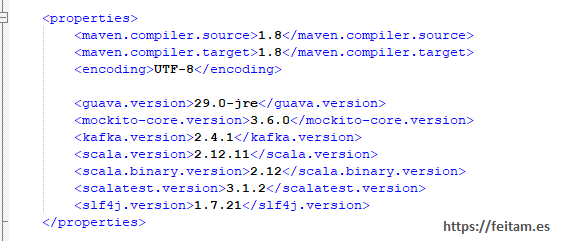
If we install this version of connecto kafka-connect-sap in the container named 'connect' in the file 'confluent_kafka.yml' it will give us the following error:
java.lang.NoSuchMethodError: 'scala.collection.immutable.Range$Inclusive scala.runtime.RichInt$.to$extension0(int, int)'
And this is because the kafka-connect-sap connector uses Scala version 2.12 and the base image of the 'connect' container is 'cnfldemos/cp-server-connect-datagen:0.4.0-6.0.1' uses another version of Scala.
Here are several solutions:
* Crear una versión del kafka-connect-sap para una versión superior de Scala
* Instalar el conector kafka-connect-sap en una versión de kafka-connect-base
* Encontrar una vesión de cnfldemos/cp-server-connect-datagen que utilice la vesión 2.12. de Scala
To identify the Scala version of the kafka we have we should know that the kafka jar file has a naming format such as kafka_2.12-2.7.0.jar, indicated the first number of the scala version that this example is 2.12, and the according to number the kafka version, which is 2.7.0 in this example.
What I have done is access https://hub.docker.com/y check the version of Scala from the latest tag to the first one I find to use Scala 2.12, and I found it in version 'cnfldemos/cp-server-connect-datagen:0.3.2-5.5.0':
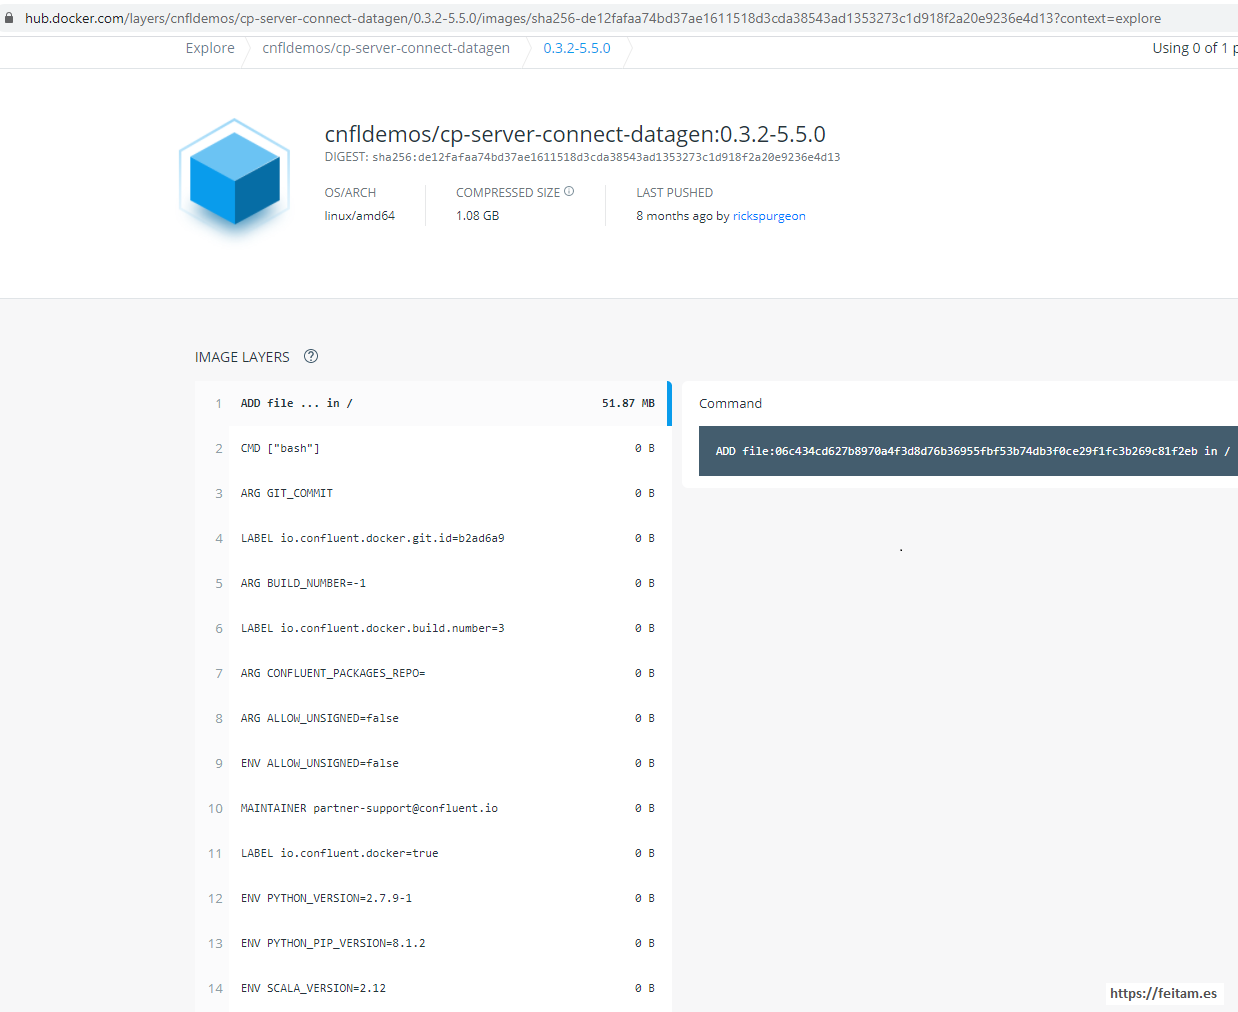
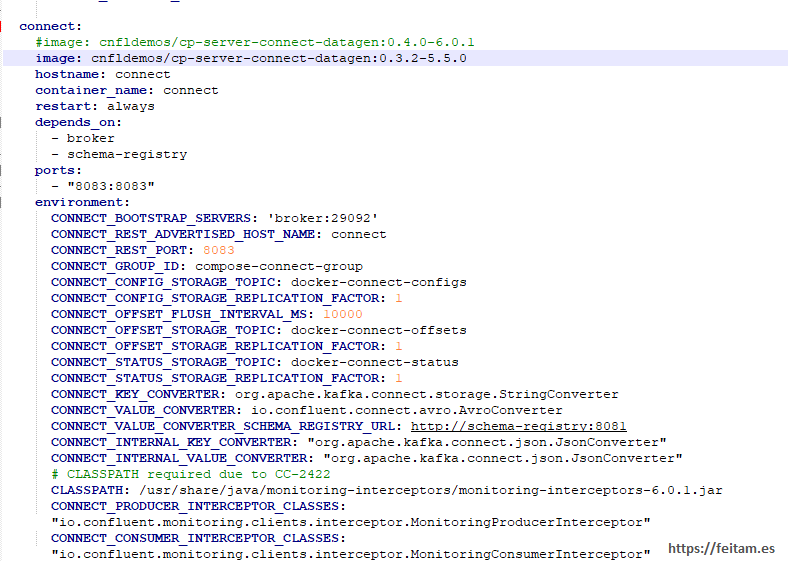
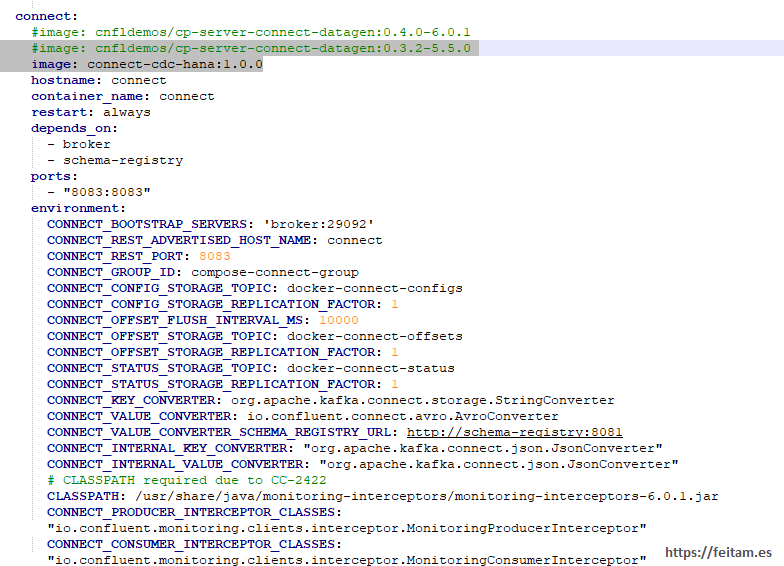
In the confluent_kafka.yml file I comment out the line of the base image of container 'connect' to 'cnfldemos/cp-server-connect-datagen:0.4.0-6.0.1' and add the one I found 'cnfldemos/cp-server-connect-datagen:0.3.2-5.5.0':
And to download the new image we run again (before stopping the previous run with 'Ctrl+C' or 'docker-compose -f confluent_kafka.yml down'):
docker-compose -f confluent_kafka.yml up
Once we have the 'connect' container running again we access it with:
docker exec -it connect bash
That allows us to access the container, where we will run the following command to install the kafka-connect-jdbc connector as usual with:
confluent-hub install --no-prompt confluentinc/kafka-connect-jdbc:5.5.0
And this command will install us this kafka-connect-jdbc connector that we will use to leave the data in the PostgreSQL target database in the /usr/share/confluent-hub-components folder.
When we have done the above, we can exit the container, pressing 'exit' (this does not stop it, we leave it), and create the new image with the command:
docker commit connect connect-cdc-hana:1.0.0
which creates a new image named connect-cdc-hana with tag 1.0.0 from the current situation of the currently running 'connect' container.
We stop everything with:
docker-compose -f confluent_kafka.yml down
And we check that we already have the new image with 'docker images' that we have already seen:
And in the confluent_kafka.yml file in the definition of 'connect' we comment the line 'image: cnfldemos/cp-server-connect-datagen:0.3.2-5.5.0' and specify that we want to use the image that we just created that already has the kafka-connect-jdbc connector installed:
And we lifted everything to check that the whole Confluent Kafta stack starts smoothly.
We only need to configure in 'connect' the use of the kafka-connect-sap connector. We stop everything again with 'docker-compose -f confluent_kafka.yml down' and make the following changes to the original file lowered from Confluente Kafka.
Replace the line containing:
CONNECT_PLUGIN_PATH: "/usr/share/java,/usr/share/confluent-hub-components"
by:
CONNECT_PLUGIN_PATH: "/usr/share/java,/usr/share/confluent-hub-components,/opt"
Where we are telling you that in addition to /usr/share/java and /usr/share/confluent-hub-components the installation directories of the available connectors are used /opt. I've checked before that this folder has nothing not to interfere with.
And related to this we add at the end of the definition of the container 'connect' the following line:
# FOR kafka-connect-sap and ngdbc.jar
    volumes:
      - /data/docker_connect/confluent-hub-components/:/opt
that what is mapping the /data/docker_connect/confluent-hub-components directory of the host server running docker-compose, and that we remember that within this folder is the kafka-connect-sap directory. And so when you boot the 'connect' container you will look for connectors in addition to /usr/share/java and /usr/share/confluent-hub-components in the /opt folder, which is where you will find the kafka-connect-sap connector plus the ngdbc.jar file of the Hana database JDBC driver.
Starting over Confluent Kafka we already have everything available and configured to define the connector instances and check the proper functioning of the CDC. We root Confluent Kafka again with 'docker-compose -f confluent_kafka.yml up'.
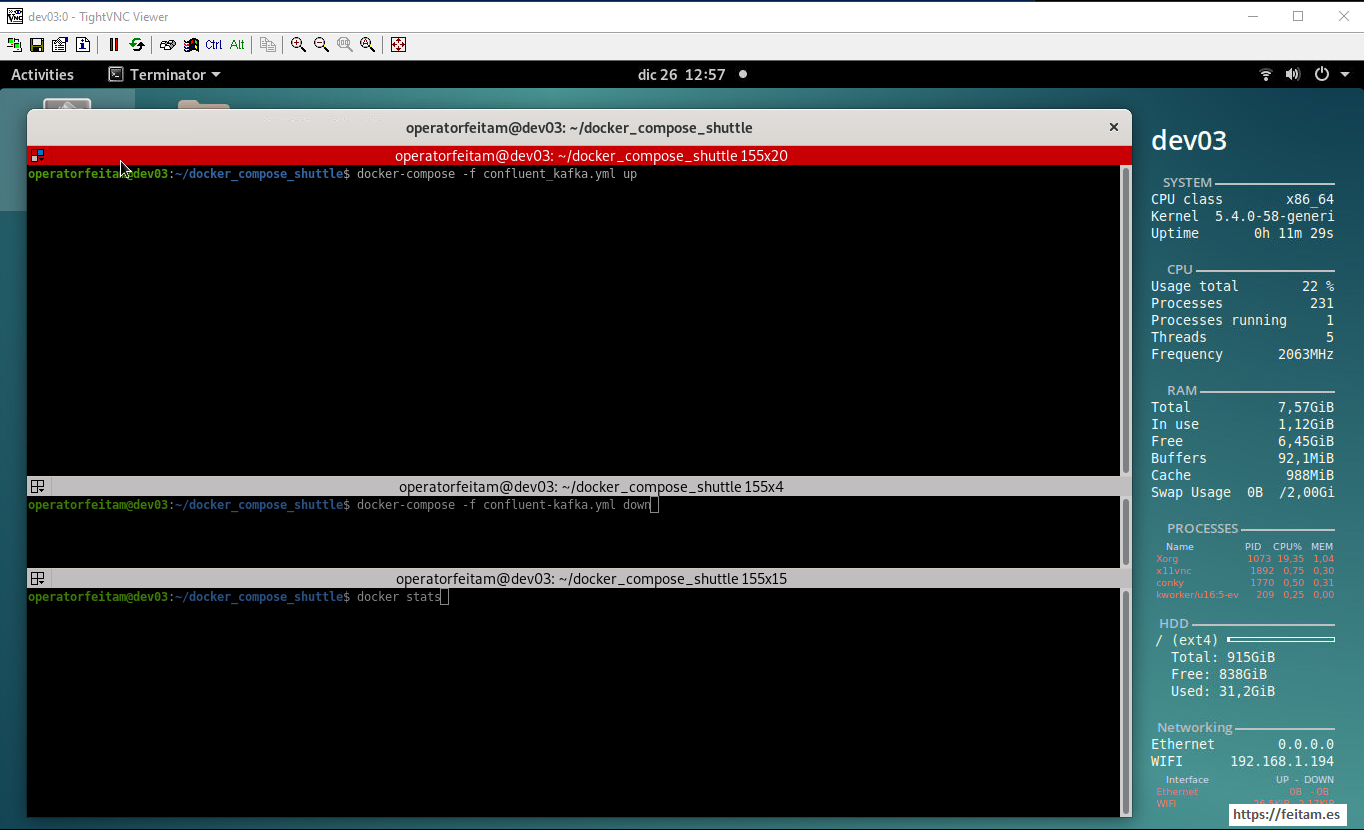
Image of the dev03 server screen where we will run the docker-compose of all Confluent Kafka technology staff in the top pane, the command 'docker-compose -f confluent_kafka.yml down' prepared in the middle pane to stop it when required, and with the 'docker stats' command in the lower pane to see the execution of the various Confluent Kafka containers. We note that before running the 7.5 GB of RAM we have, we have in use 1.12 GB of RAM and available 6.45 GB of RAM.
We run the boot command in the top pane 'docker-compose -f confluent_kafka.yml up' and the one in the lower pane to see the execution of the new containers (I remember that not all of them are required for this CDC example, only those listed in the top diagram of the architecture are required):
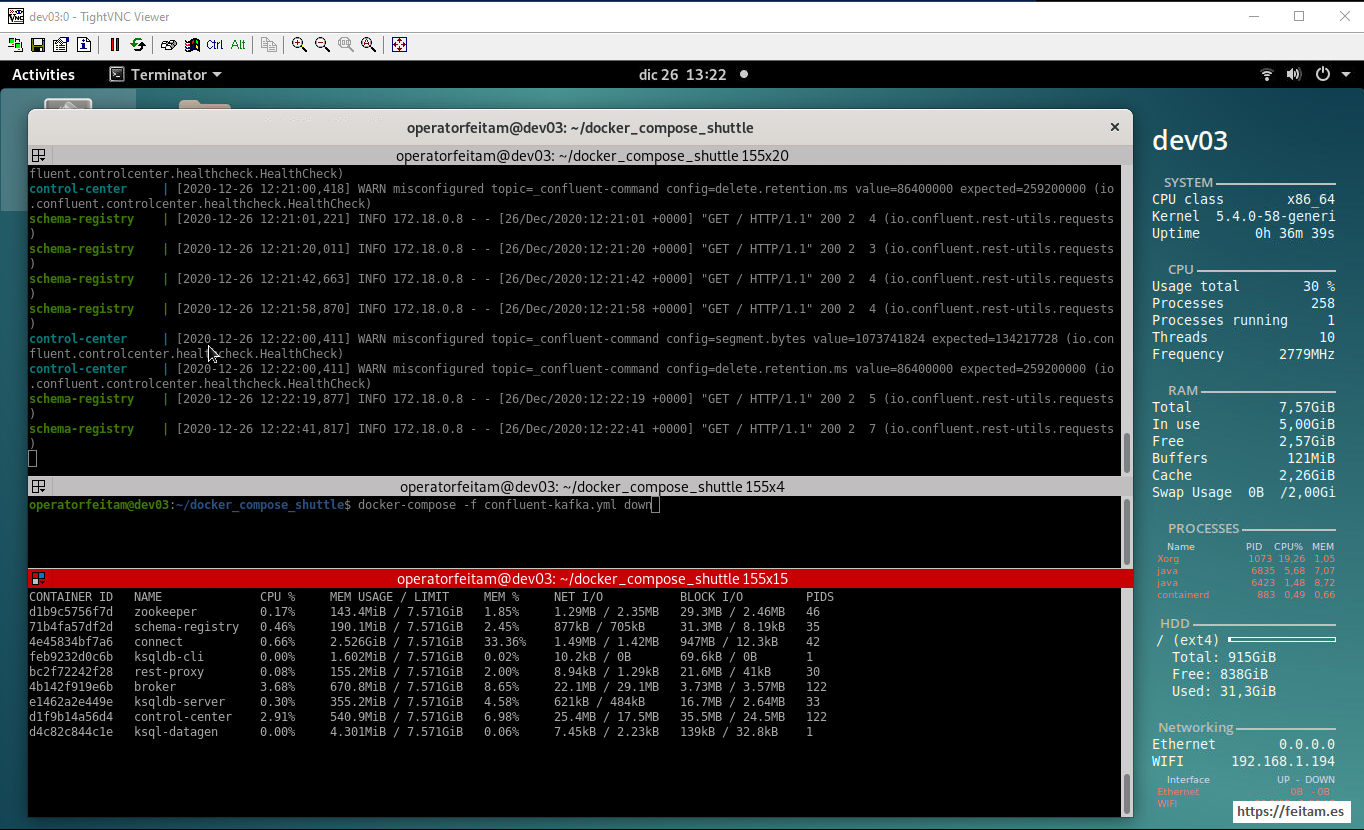
We see that between 3 and 4 GB of RAM are required to run the different Confluent Kafka containers, and a CPU consumption of 30%.
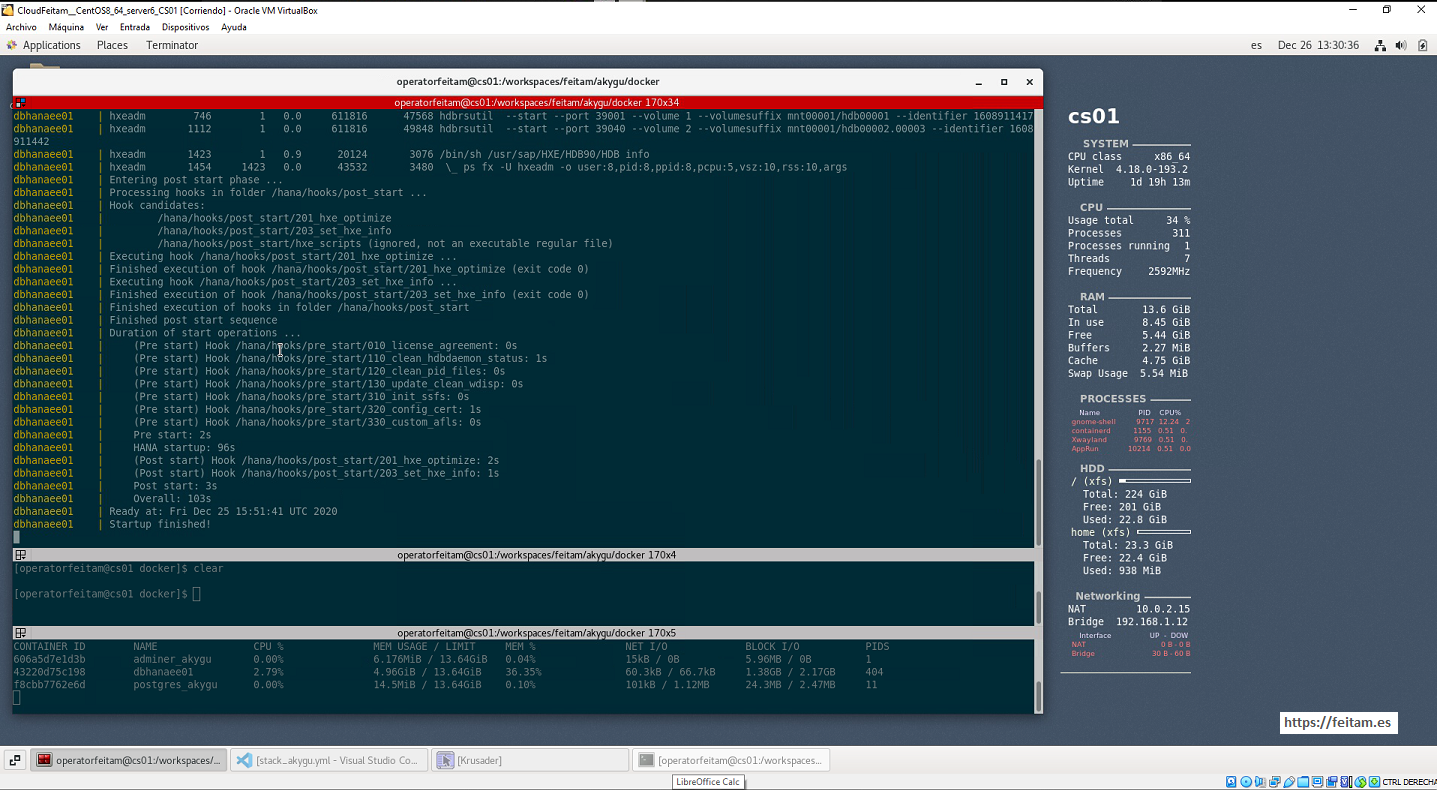
Running Hana and PostgreSQL databases on the CS01 virtual machine has the following aspect of CPU and memory consumption of 35% CPU and nearly 9 GB of RAM:
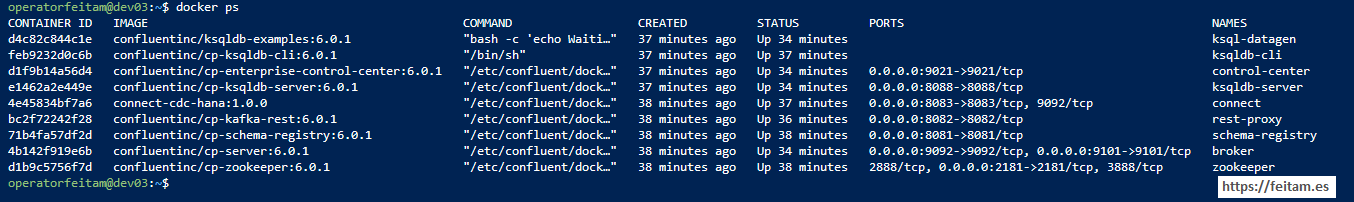
Now that we have everything up, the databases and technological staff of Confluent Kaffa, and if we run on dev03 the command 'docker ps' we will see the containers running and their ports to be able to get an idea of how to access each service, considering that there are ports that are publicly accessible such as the port of the 'rest-proxy' that is the 8082 , or port 8083 of the 'connect' container that is used for connector API calls and be able to manage their status, create, delete, stop, etc.
Connector instances can be created through the API or through the Confluent Kafka Control-center Console. Let's first access the Enterprise Console to see its main features from my point of view, remembering that this console is not available in the Comunity version, considering that a "delicate" productive environment should always be had this Confluent Kafka console and other replication products and monitors that Confluent Kafka has needed to detect bottlenecks , sizing topics, etc.
To access the enterprise console, we run the following from a browser:
http://dev03:9021
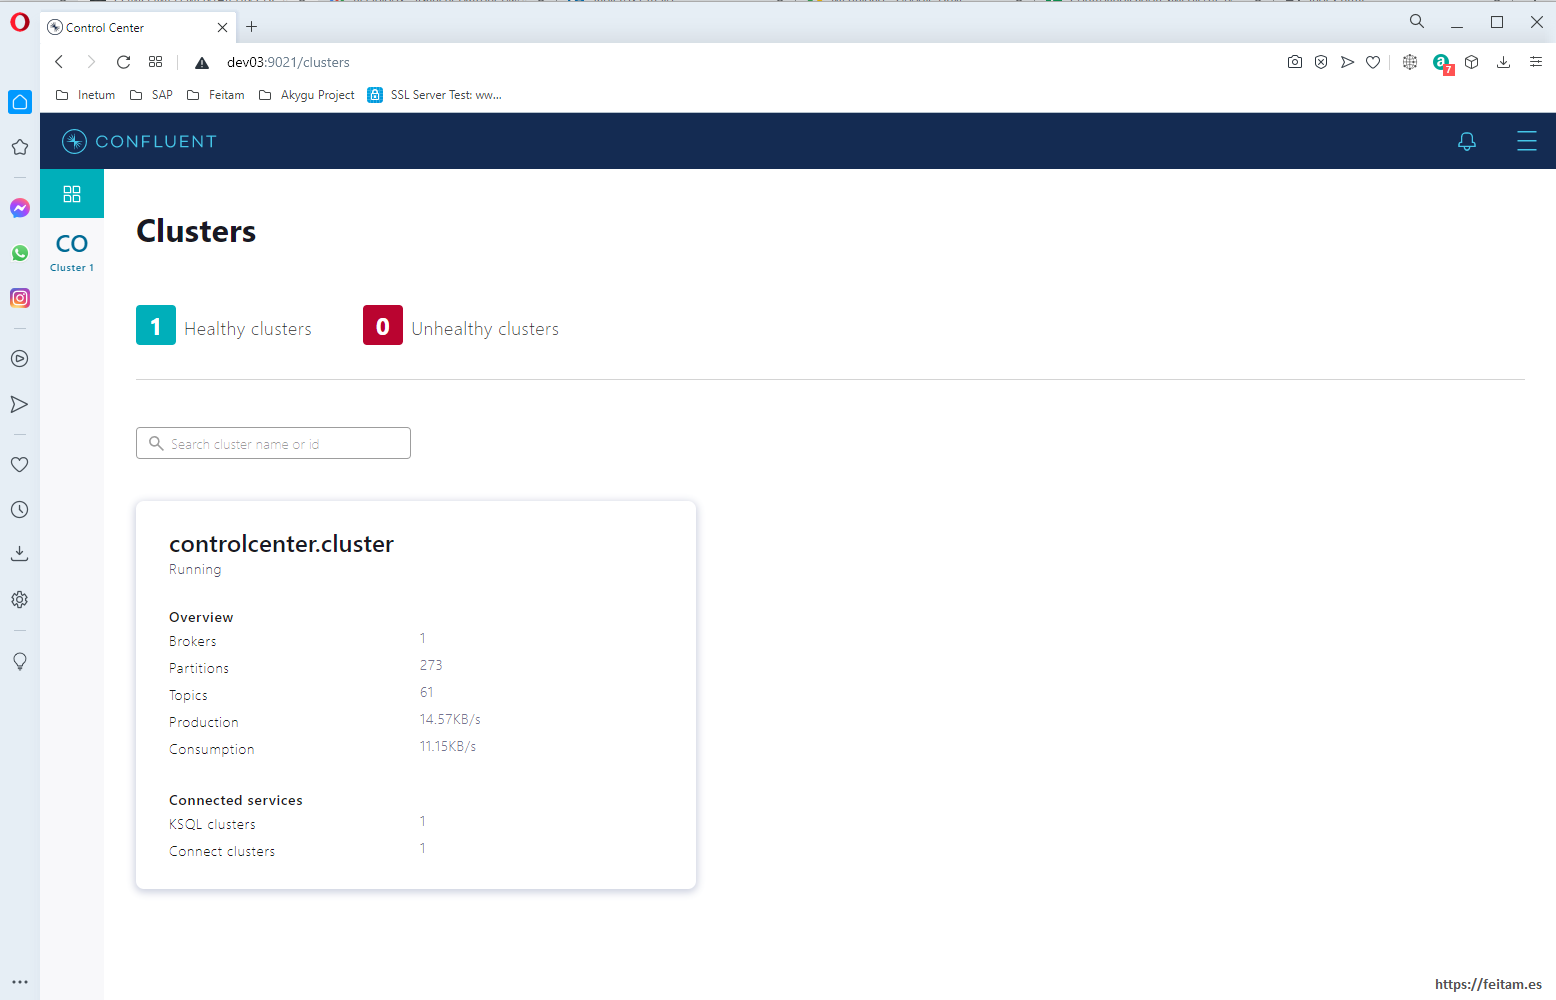
We see that we only have one cluster, and that it is running smoothly. By clicking on the 'Cluster 1' link we see the available menu options:
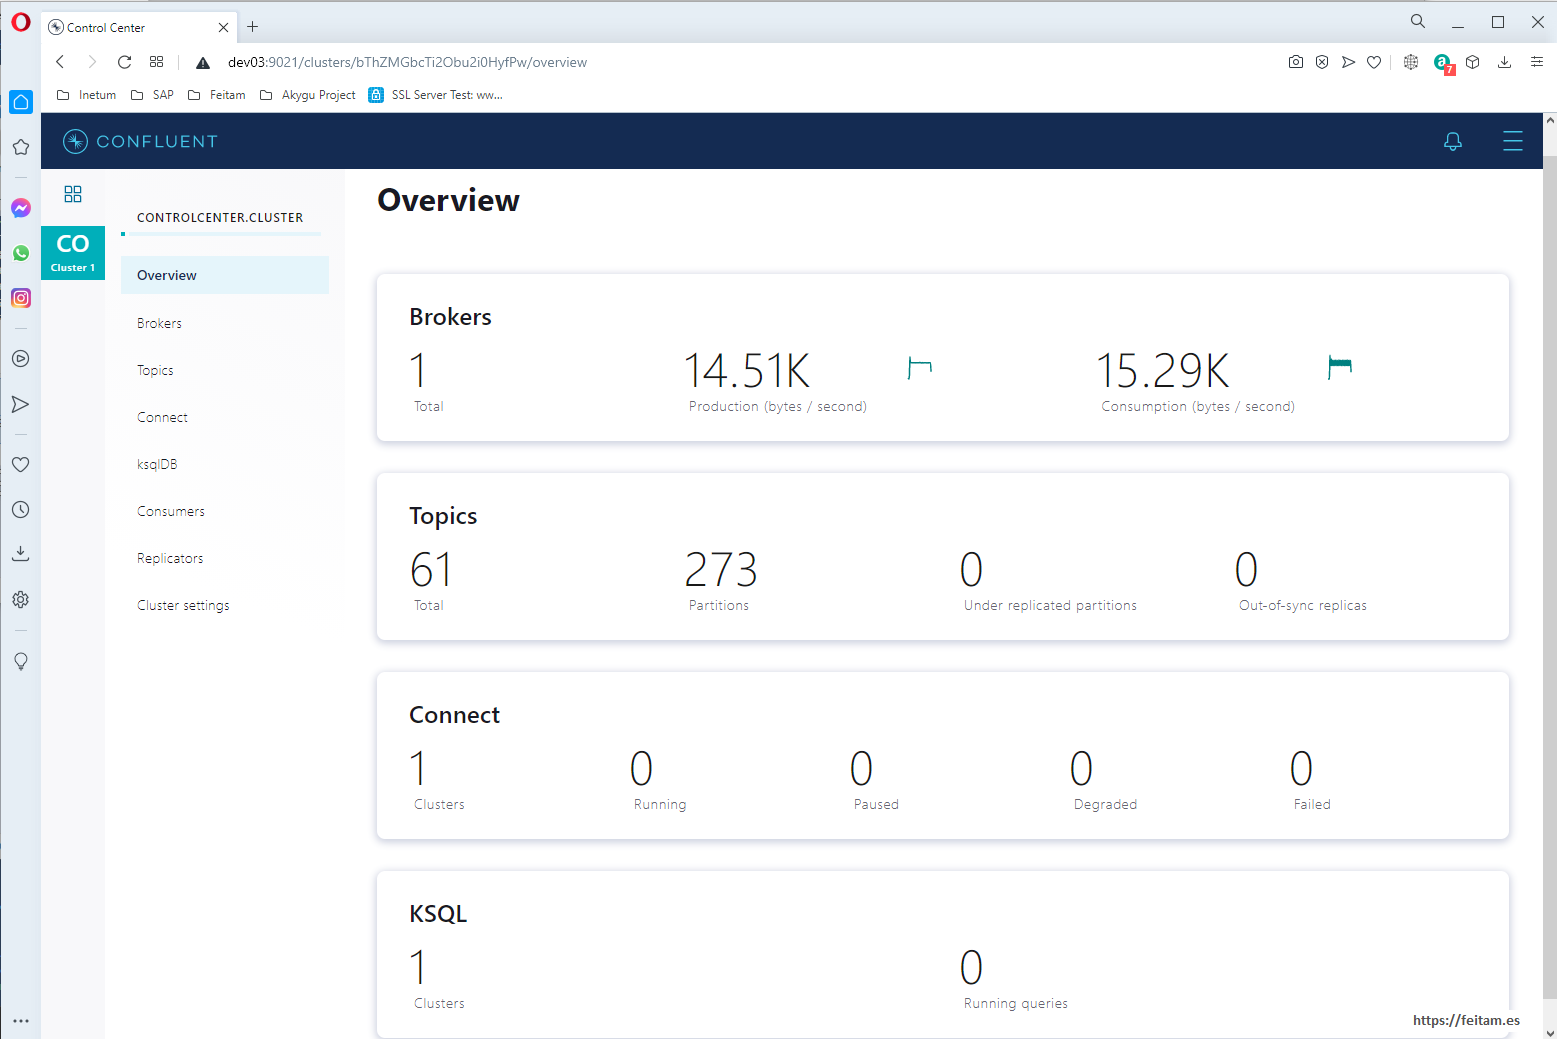
From the options that are there we will look at the Topics, Connect and Consumers.
In Topics we can view the topics that currently exist and create new topics or modify them:
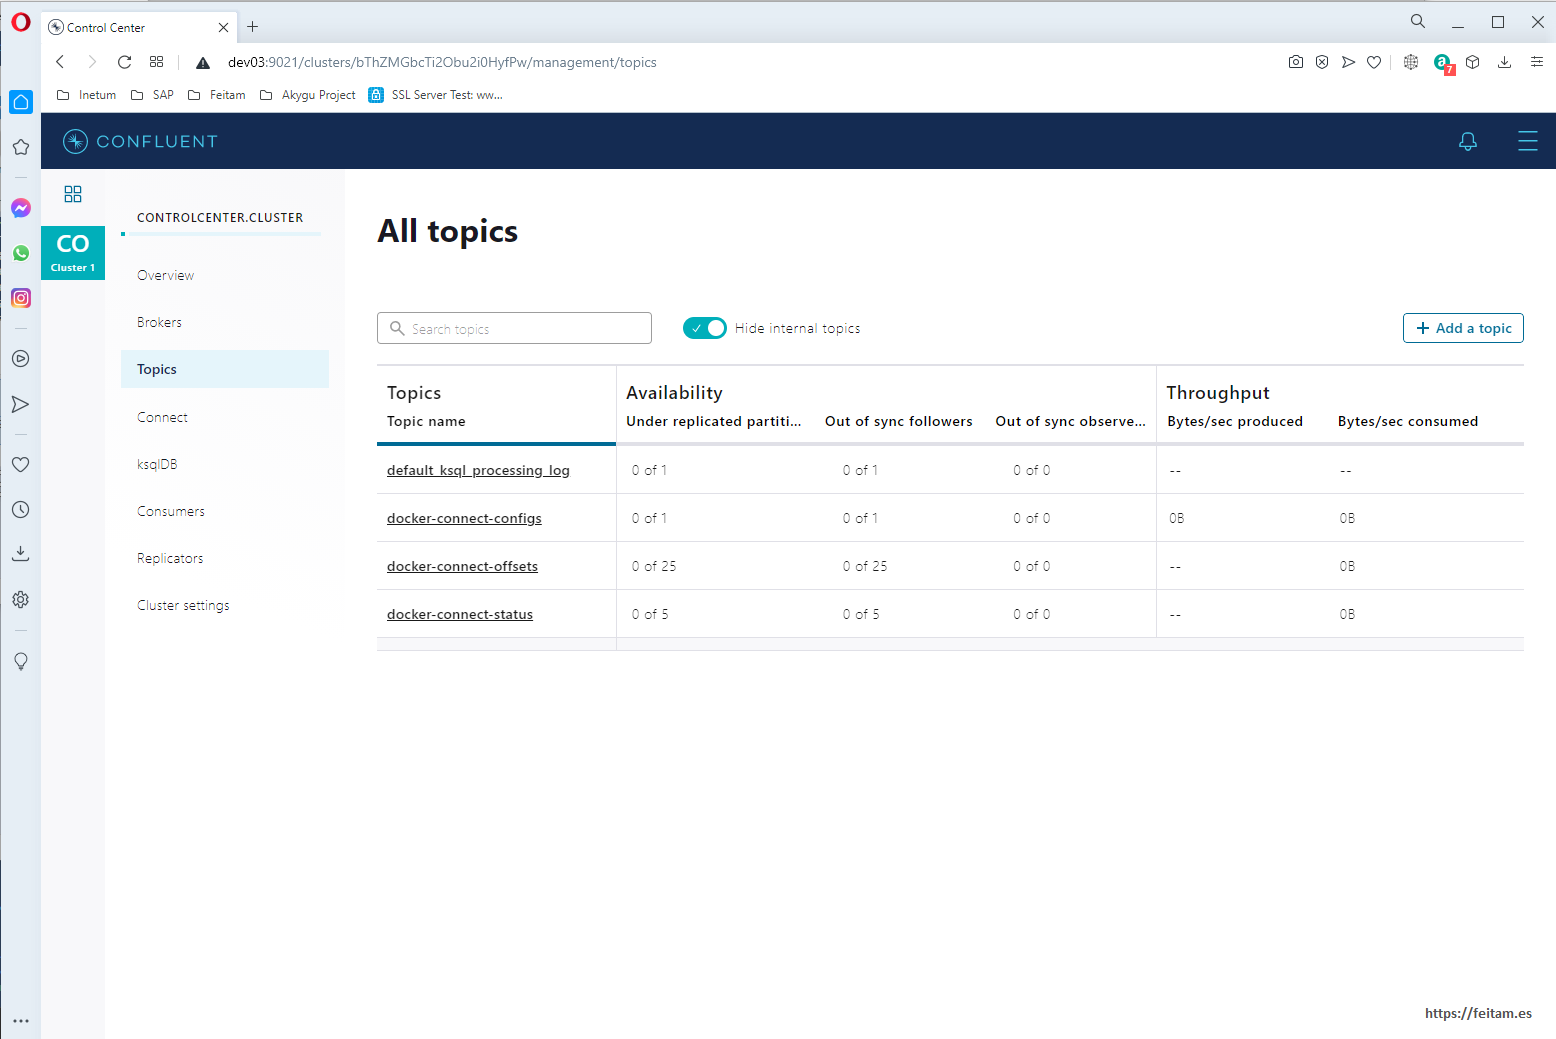
For now we will not create the topic we need from here, as we will define it in the kafka-connect-sap connector so that it is automatically created in the first message sent to it. Then if we will modify from this console the persistence of the messages in this topic.
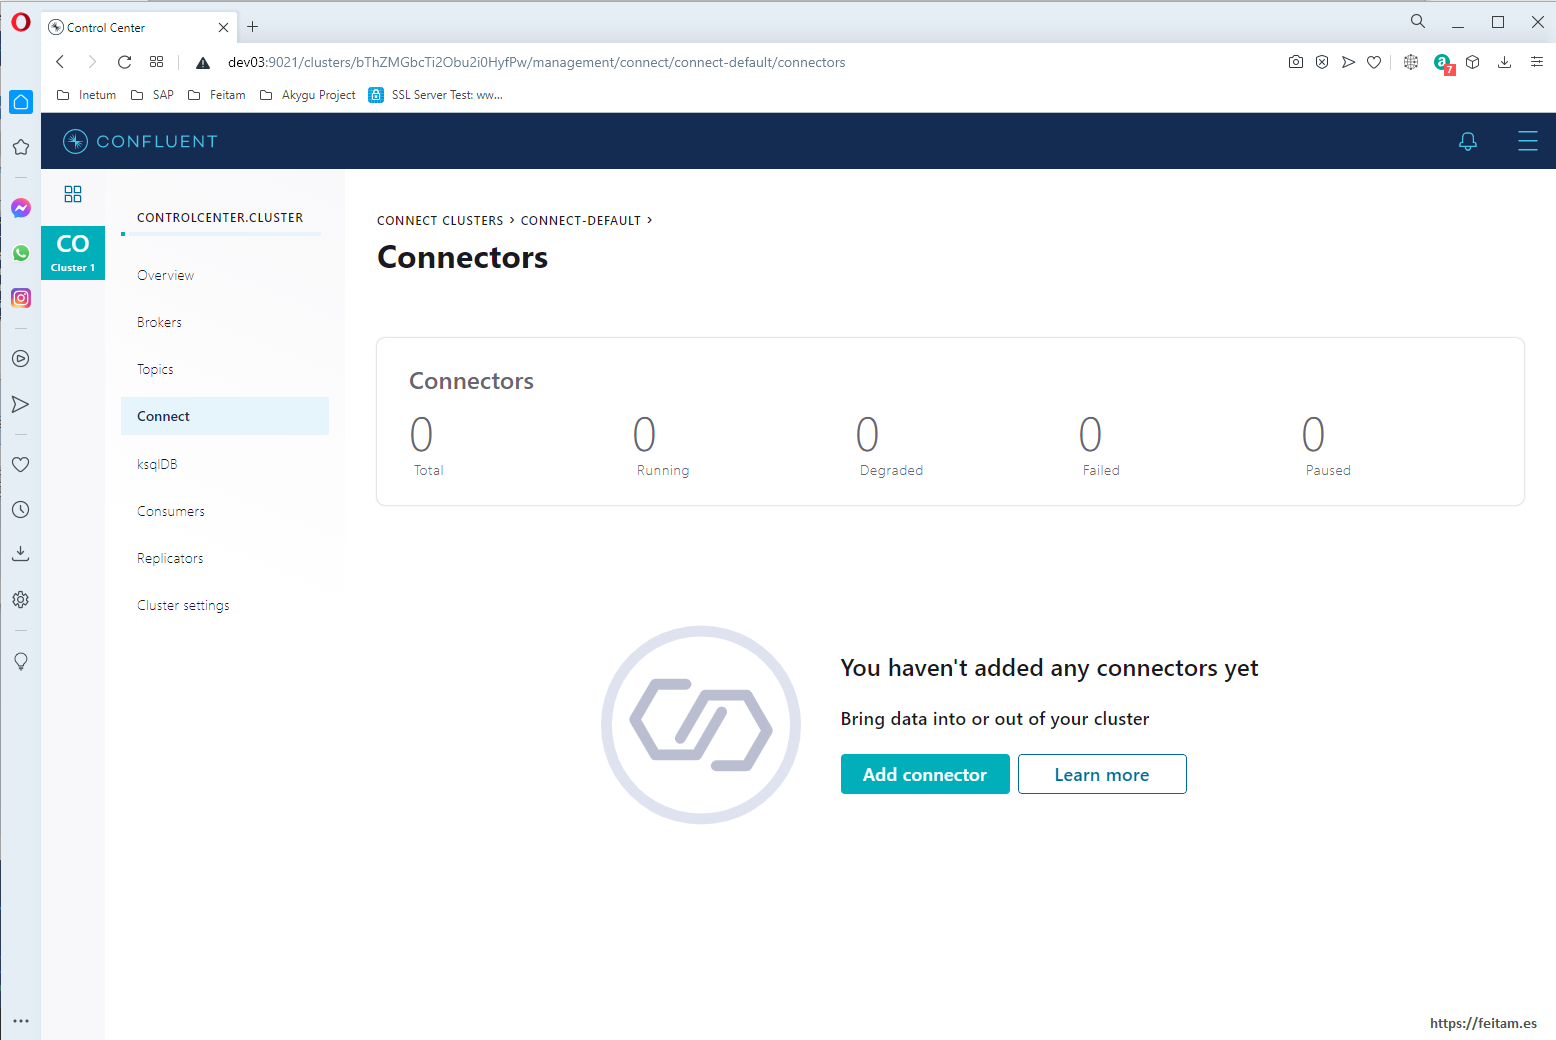
In the Connect option we see the connector clusters, only detecting the connect-default of our 'connect' container:
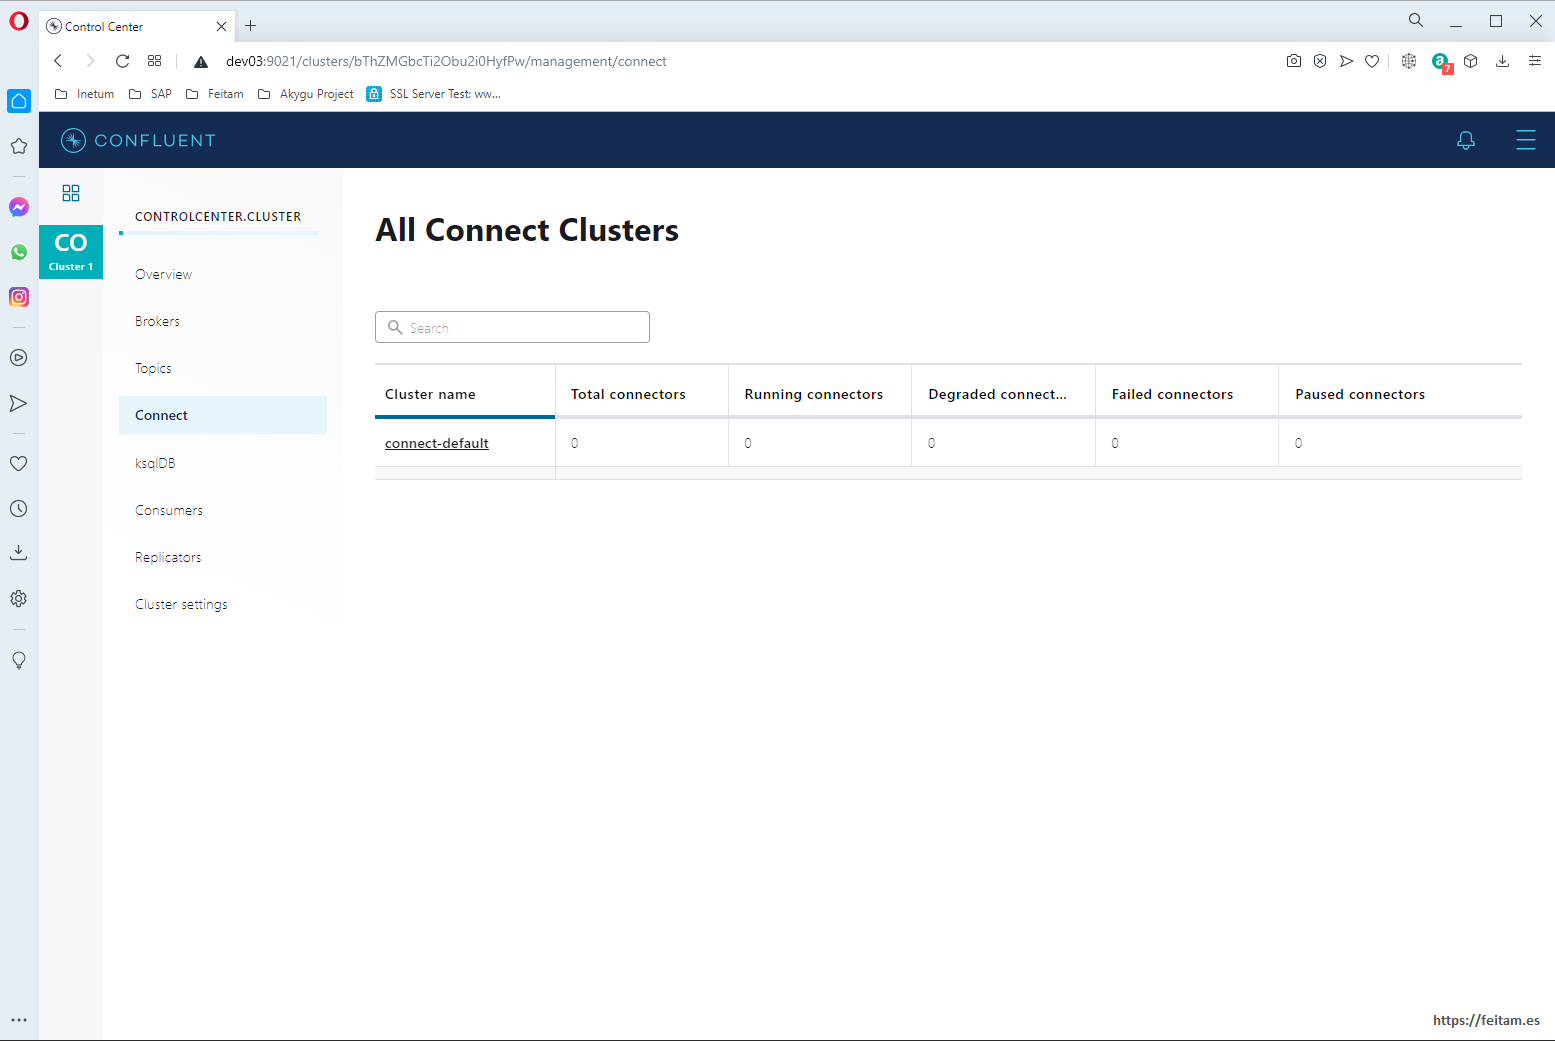
And by clicking on 'connect-default' we see that it does not have any connector instances defined for now but that there is an "Add connector" button to define these instances:
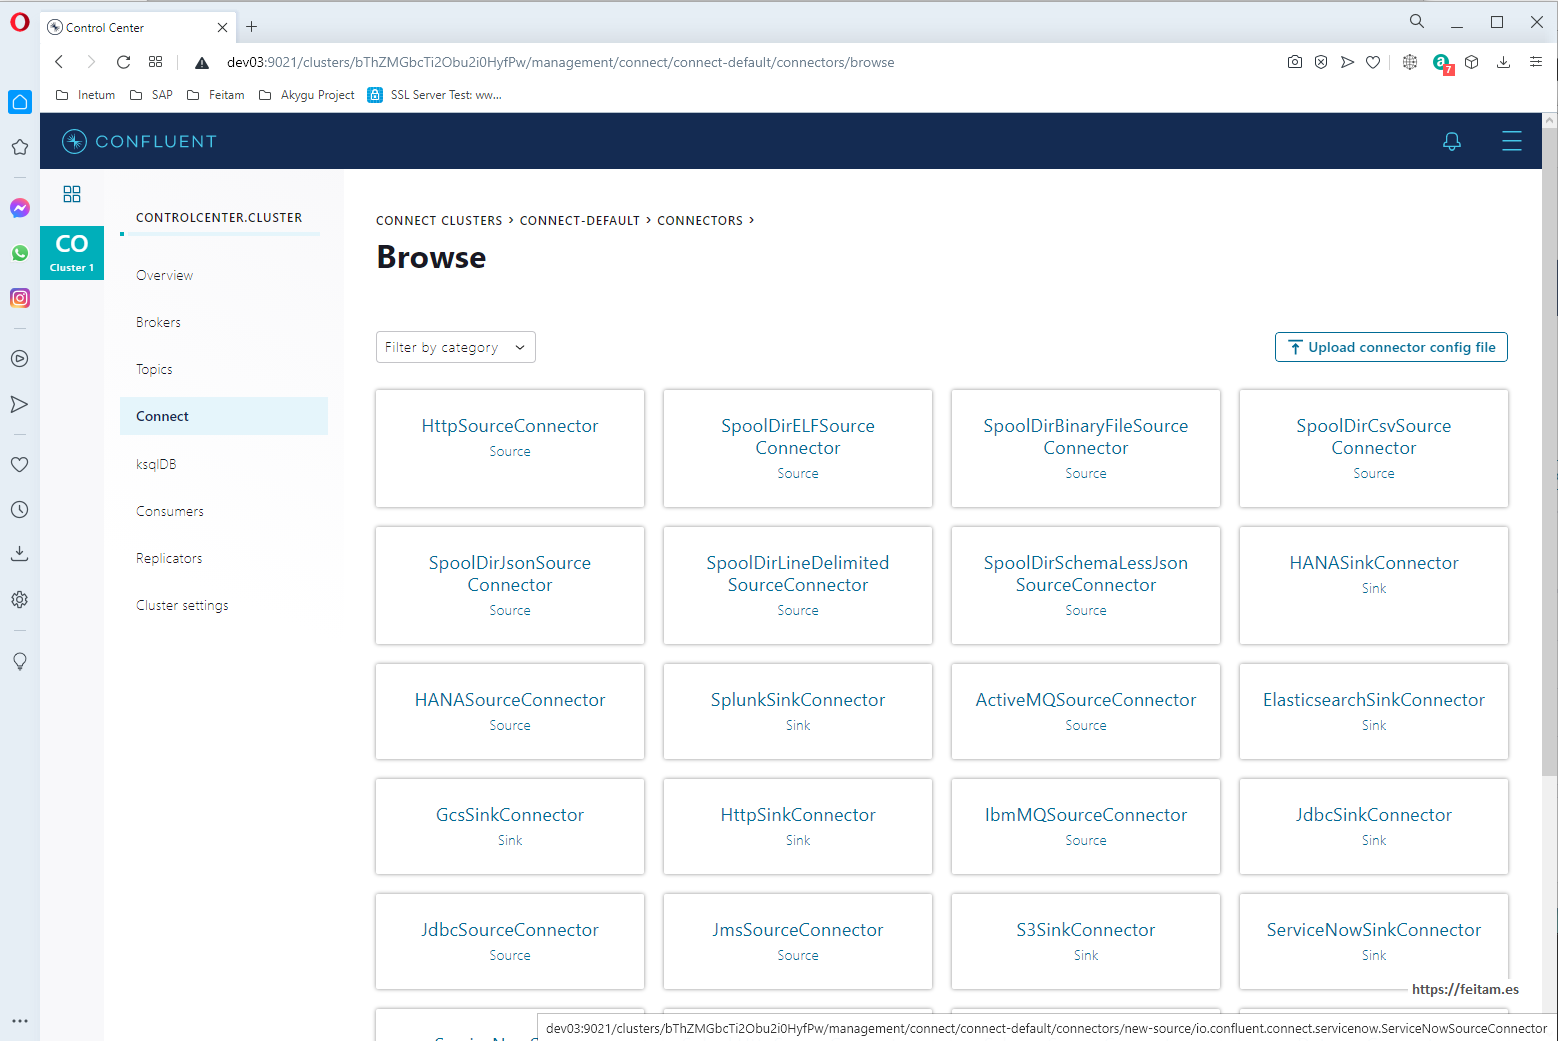
If we press the "Add connector" button we see all the available connectors installed, the ones that carried the base image and those that we installed in the 'connect' container with the command that we have already seen 'confluent-hub' or leaving the connector jar in one of its connector scanning paths as we have done with the kafka-connect-sap connector. I see that we have the HANASourceConnector connector (which is the kafka-connect-sap source category) and the JDBCSinkConnector (which is the kafka-connect-jdbc connector sing category we have installed). Depending on the base image you would have used and depending on the connectors you have installed we will have some connectors or others available to use:
On this screen let's look at the "Upload connector config file" button which is the one used to create a connector instance by attaching a file with the connector properties, in a similar way to how we will do with the API, but in properties format file not in JSON format.
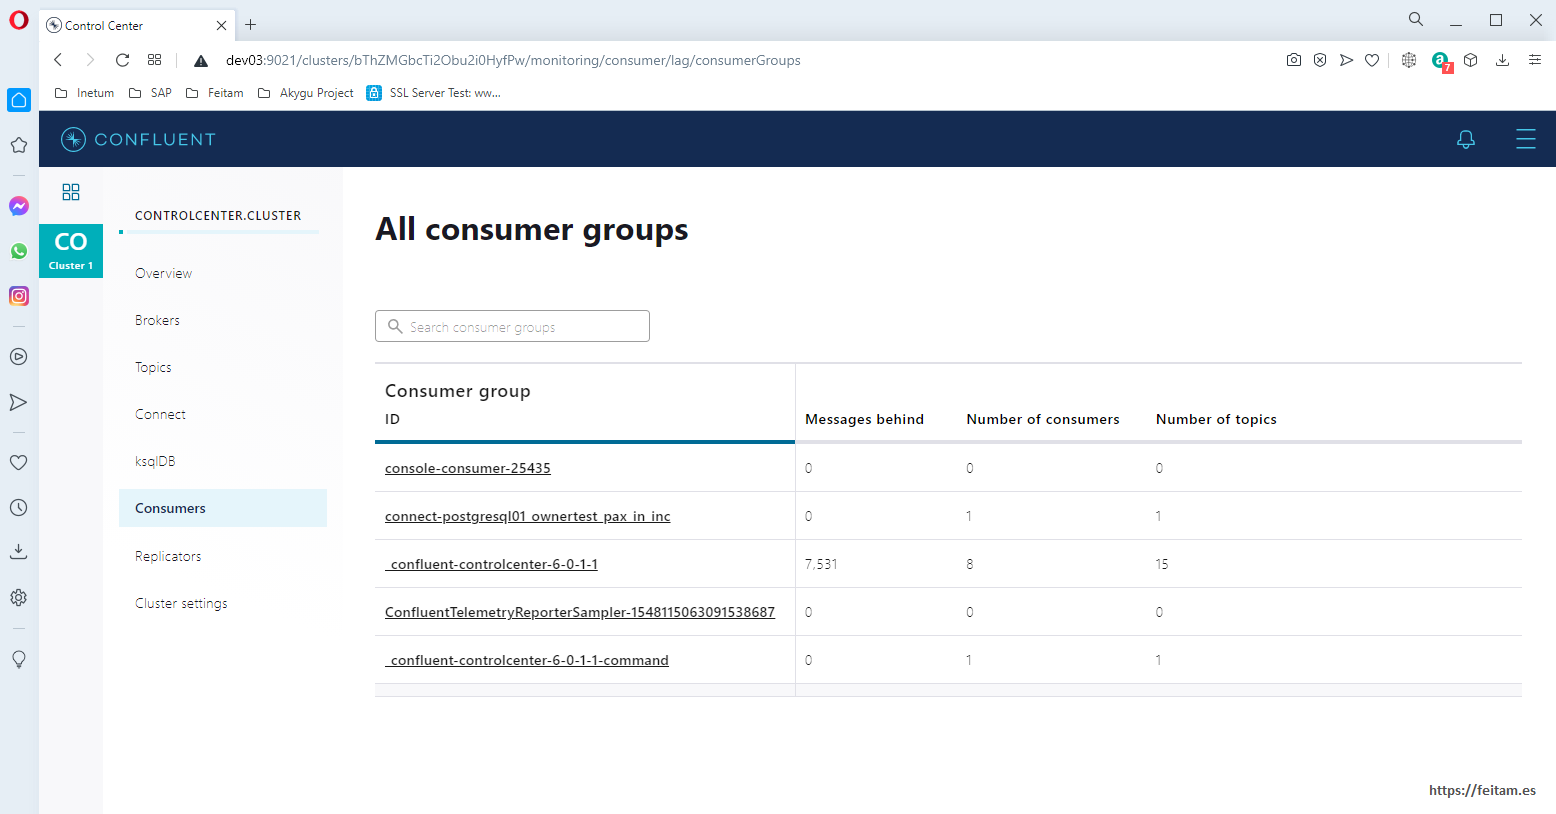
And lastly and very importantly, in 'Consumers' we see the different consumers of topics:
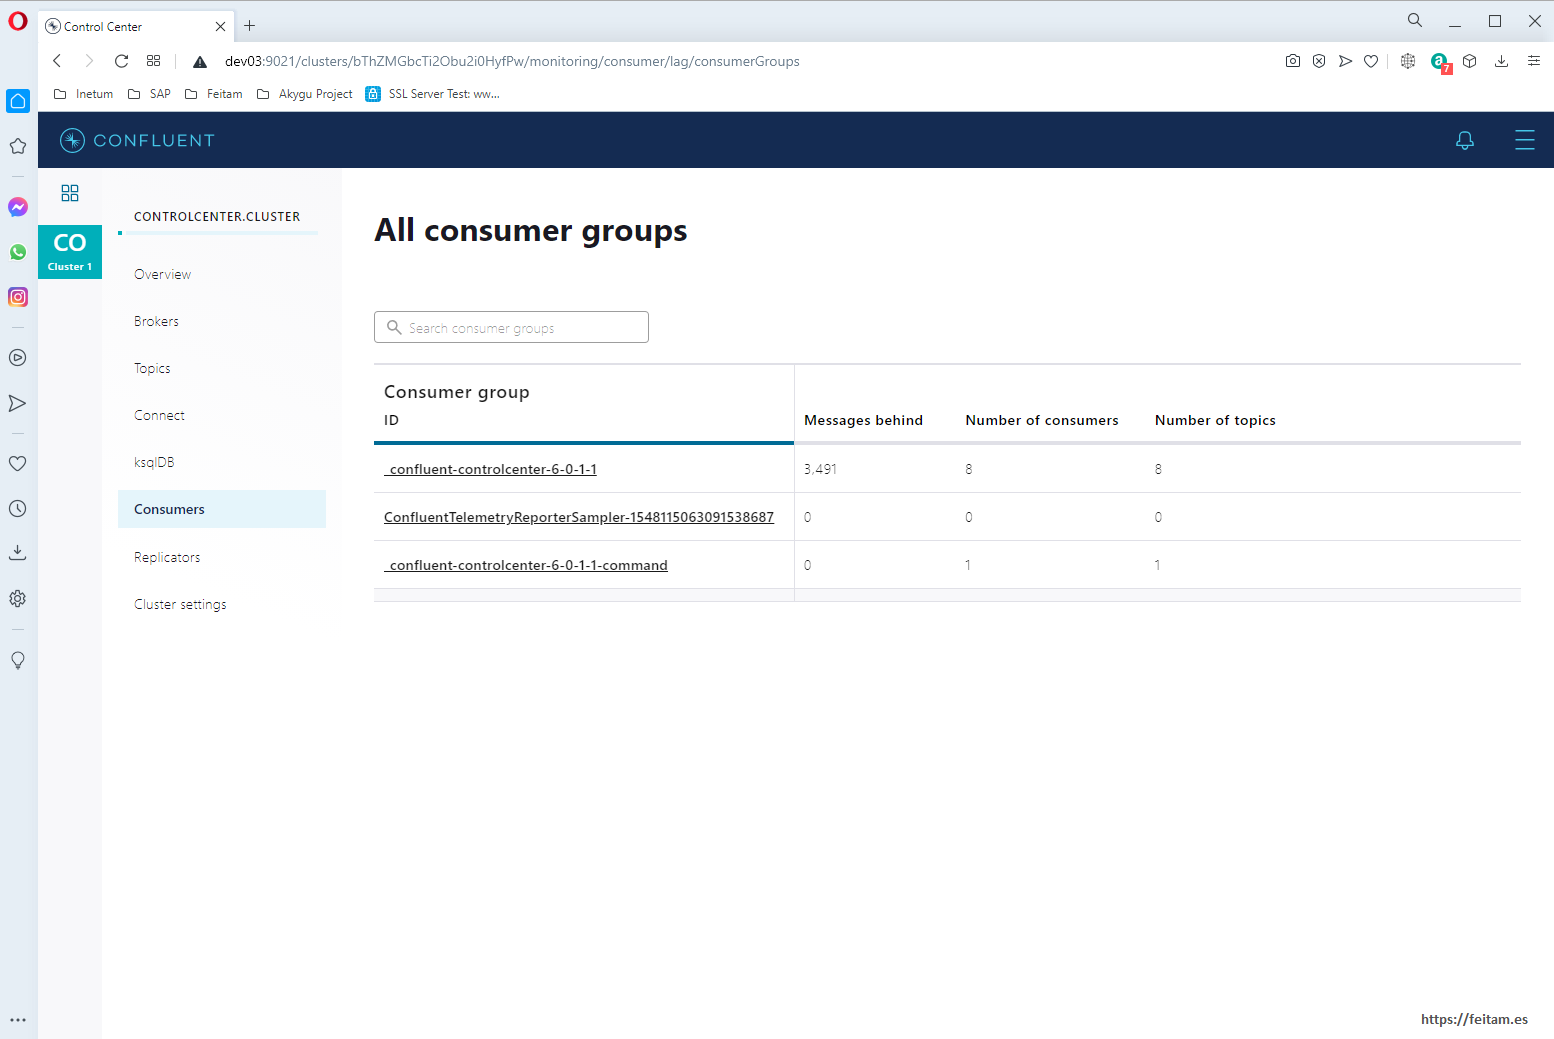
Kafka, you have to understand. It is important to understand the definition of topic, with its partitions, its replicas, holds, size, Avro message schema, etc. And understand consumers and their offset management, etc. This is the first thing to study to understand the working function well. I recommend you read the kafka documentation to implement connectors from the interfaces provided by Apache kafka and forces you to all this offset management so that when a connector stops, when you start it again continue the corresponding offset so as not to process a message twice.
The following URL https://docs.confluent.io/platform/current/connect/references/restapi.html the Kafka Connect API is detailed. From this we will see the basics being able to run with curl or Postman or similar.
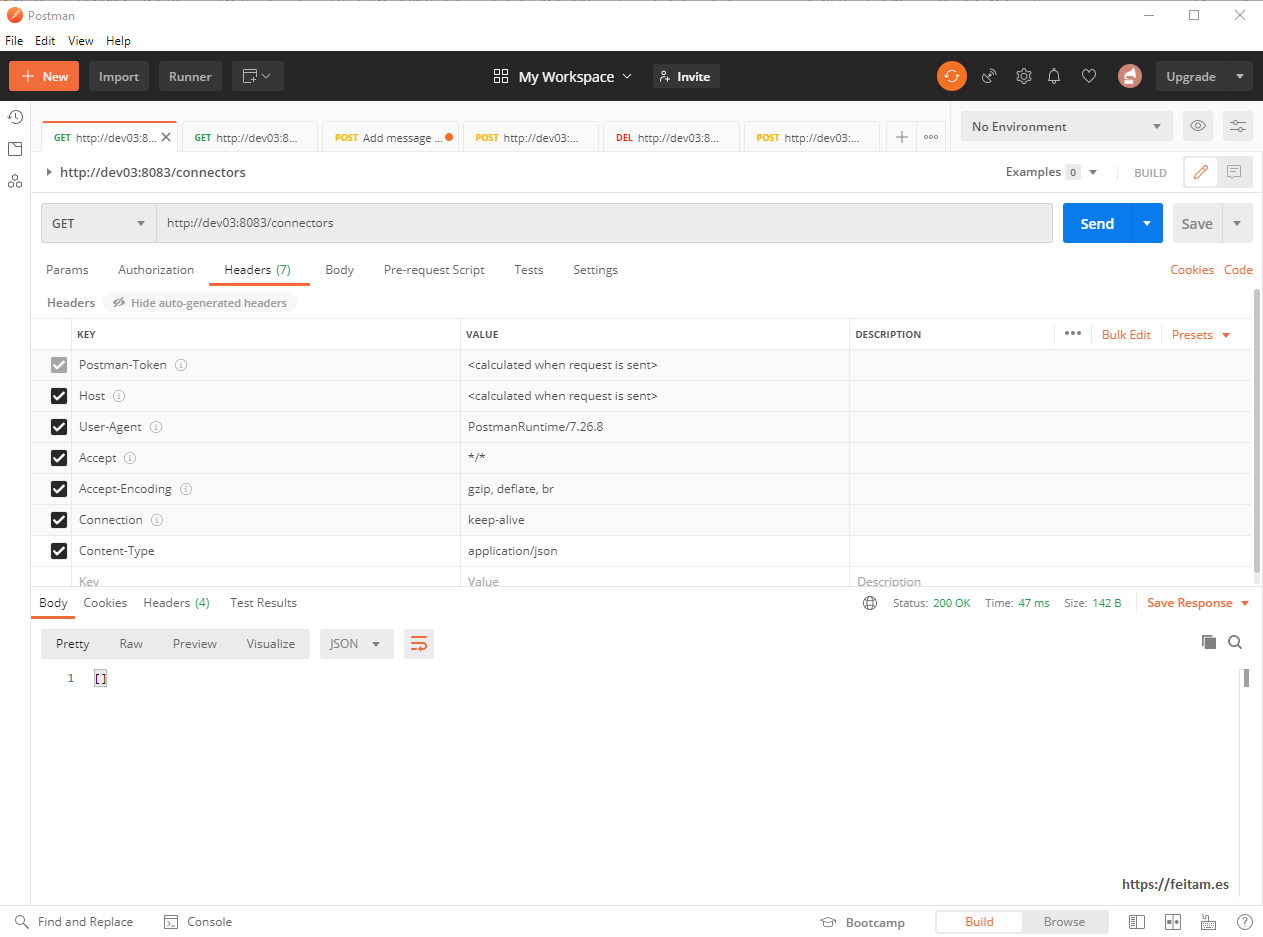
With GET requests to the /connectors context I get the instances (not to be confused with the available connectors, which are like connector library installations) of available connectors:
C:\>curl -X GET -H "Content-Type: application/json" http://dev03:8083/connectors
[]
C:\>
We don't have connector instances running for now.
The same execution with Postman:
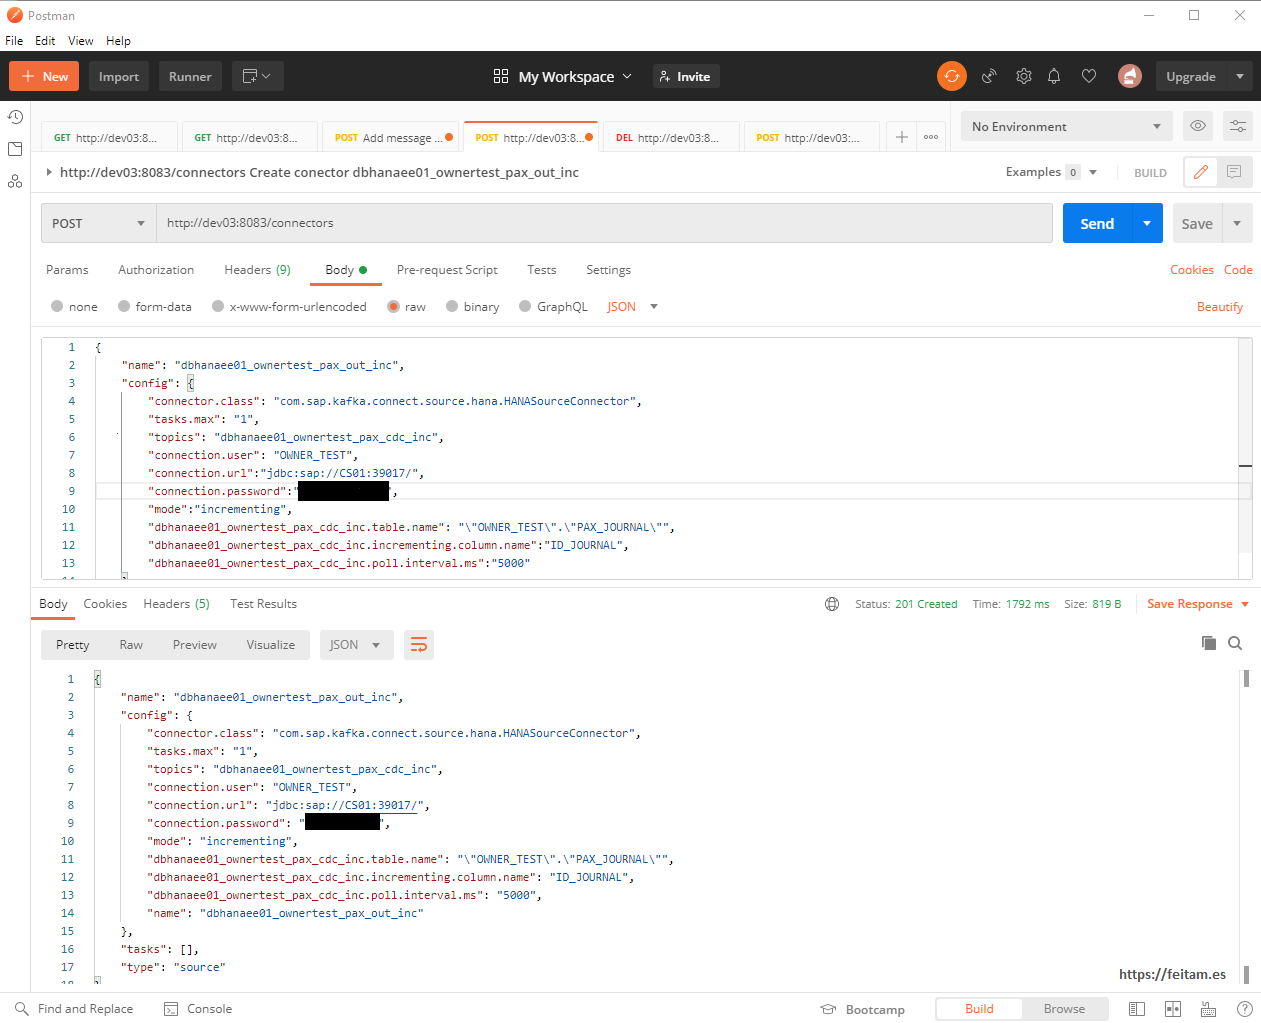
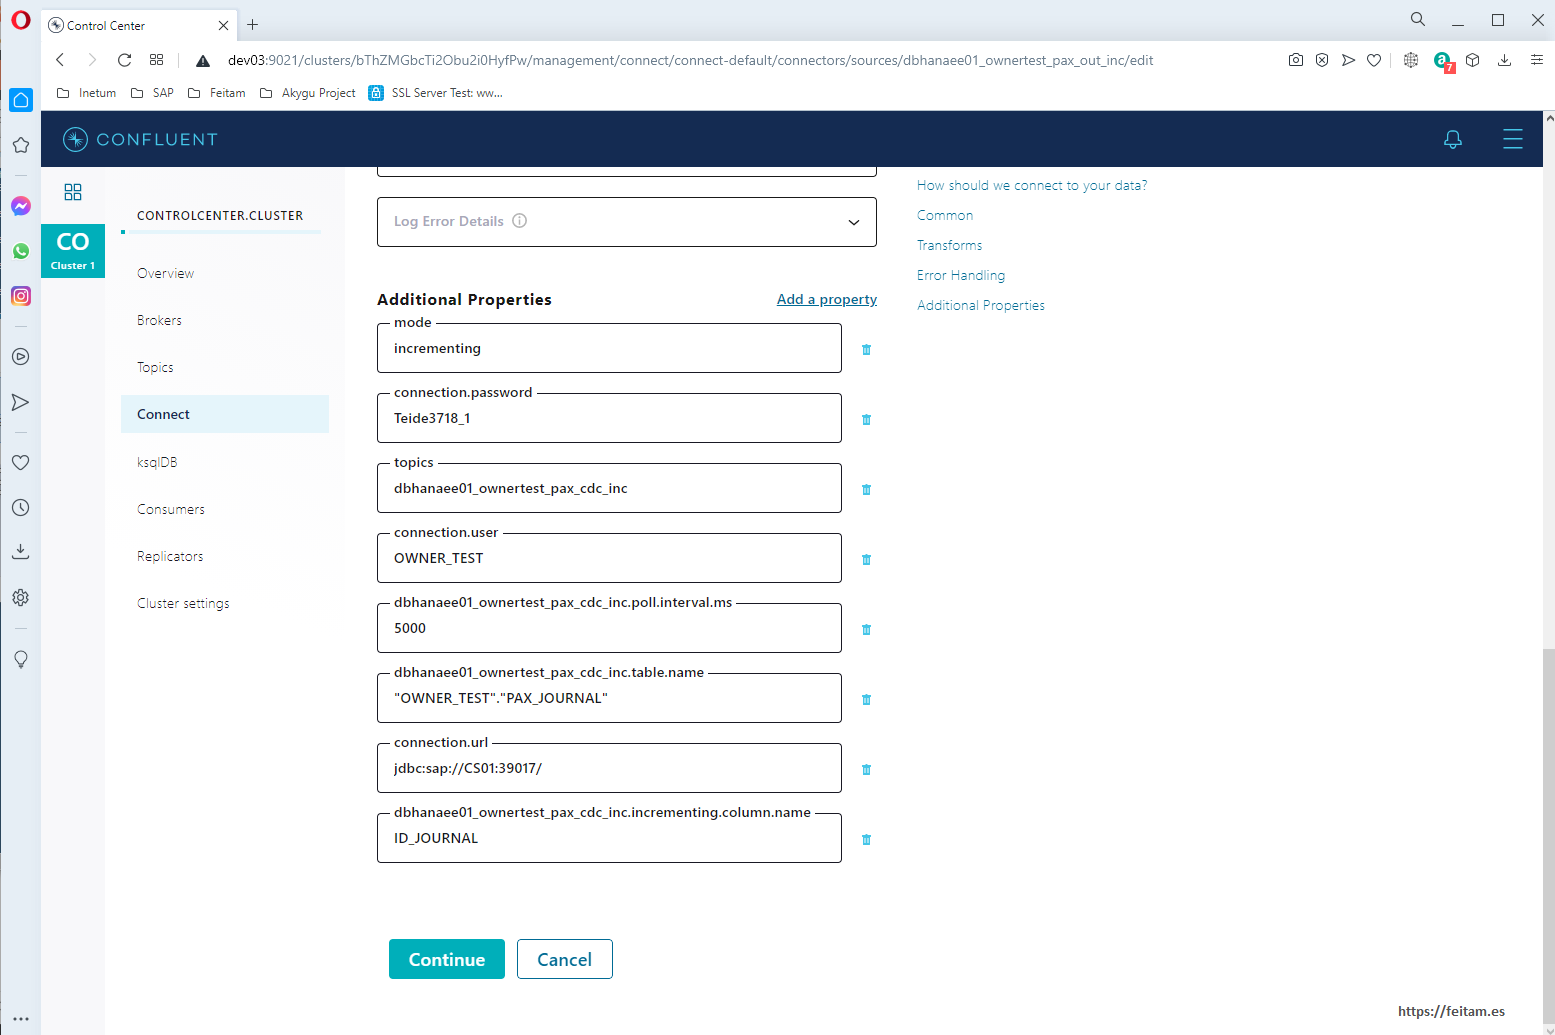
Now from Postman we'll create the source connector instance of kafka-connect-sap that we'll call 'dbhanaee01_ownertest_pax_out_inc' through the body's 'name' property with json-formatted attributes that is sent in a POST request to http://dev03:8083/connectors. The body is:
{
    "name": "dbhanaee01_ownertest_pax_out_inc",
    "config": {
        "connector.class": "com.sap.kafka.connect.source.hana.HANASourceConnector",
        "tasks.max": "1",
        "topics": "dbhanaee01_ownertest_pax_cdc_inc",
        "connection.user": "OWNER_TEST",
        "connection.url":"jdbc:sap://CS01:39017/",
        "connection.password":"peazopassword",
        "mode":"incrementing",
        "dbhanaee01_ownertest_pax_cdc_inc.table.name": "\"OWNER_TEST\".\"PAX_JOURNAL\"",
        "dbhanaee01_ownertest_pax_cdc_inc.incrementing.column.name":"ID_JOURNAL",
        "dbhanaee01_ownertest_pax_cdc_inc.poll.interval.ms":"5000"
    }
}
Where we indicate the name of the connector instance, it is specified in 'connector.class' which connector to use, you are prompted to generate only one task at most, the topic to use and which you will create if it does not exist, and the connection data to the database. In the "mode" property we indicate that we are doing incremental processing, because by default by "bulk" it sends information from the entire source table. Being incremental mode you must specify the column.name of the table that uniquely identifies each record and must be self-incremental, which in this case is ID_JOURNAL (for more detail see the connector documentation in https://github.com/SAP/kafka-connect-sap). And in the interval.ms you are told that as many milliseconds the change check action is performed on the database.
We run from Postman and this is the result:
If we run the GET of http://dev03:8083/connectors that used to return nothing to us now we see that the created connector instance returns to us:
C:\>curl -X GET -H "Content-Type: application/json" http://dev03:8083/connectors
["dbhanaee01_ownertest_pax_out_inc"]
C:\>
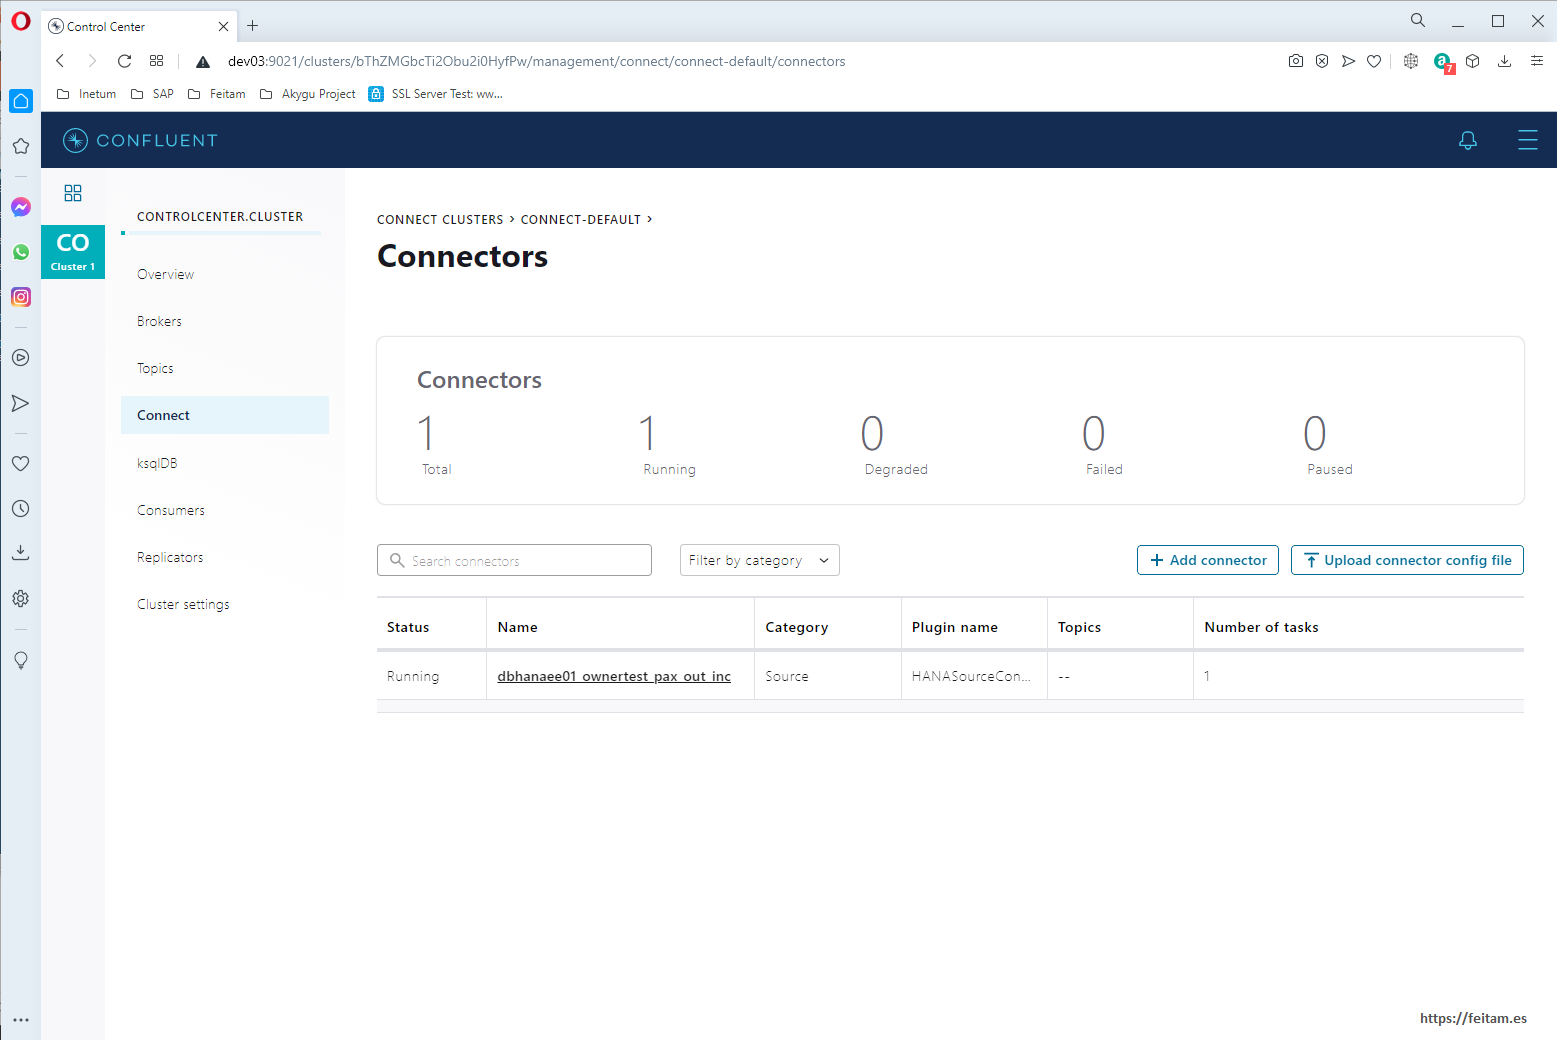
And from the web console in Connect we see that there is already a connector instance called 'dbhanaee01_ownertest_pax_out_inc' of category soruce and that is in status Running:
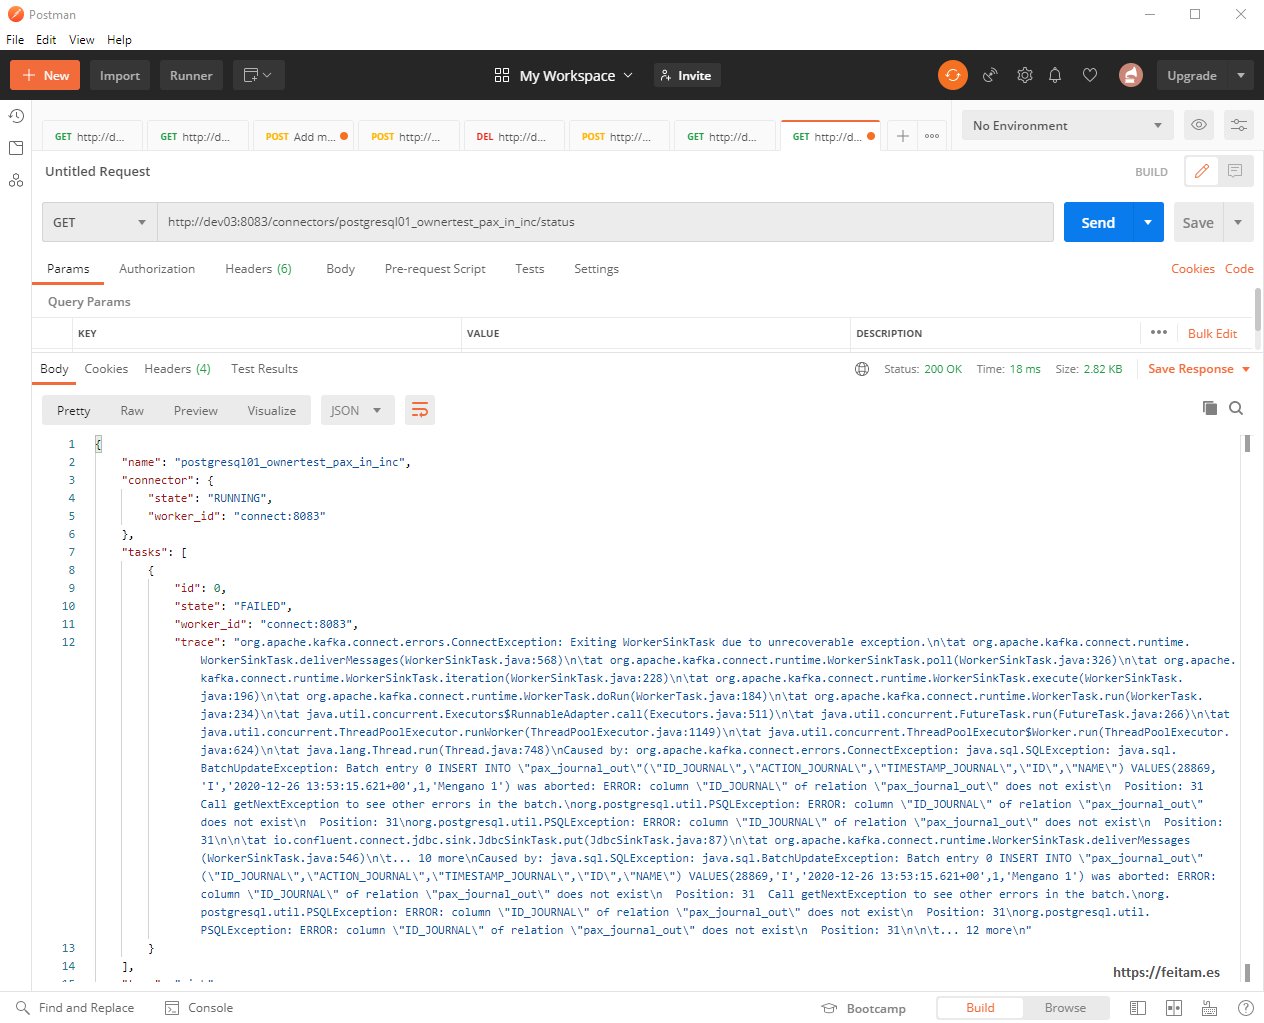
If when creating a connector you do not have to see the docker-compose execution log because the error (not JDBC driver, etc.) appears in it or you see the status of the connector that usually reports the error, for example, this actual case that I obtained when mounting this example where an error is reported in the existence of the fields (it is really because in PostgreSQL it is important if the fields are uppercase or lowercase and lowercase you have to leave it in uppercase because the Avro schema used in the topic in this integration has these values in uppercase):
We can click on the connector instance and it takes us to its page that we see that it is running without failures, and where there are a few buttons to pause and run it, plus a button to delete the instance:
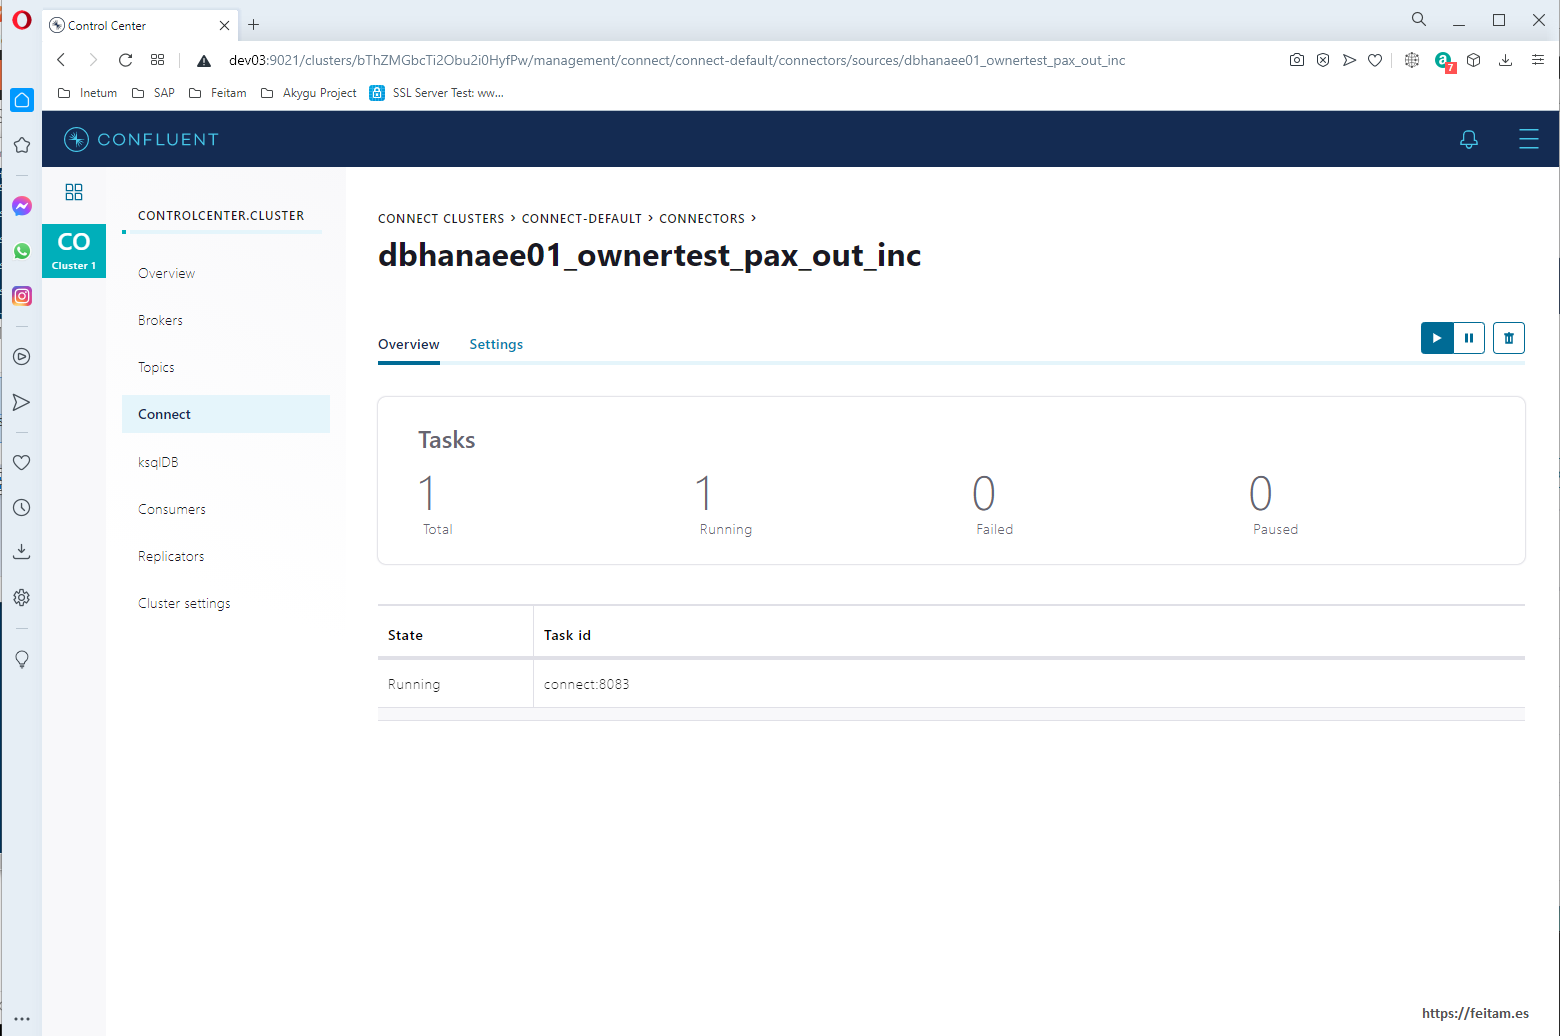
We can click on the connector instance and it takes us to its page that we see that it is running without failures, and where there are a few buttons to pause and run it, plus a button to delete the instance:
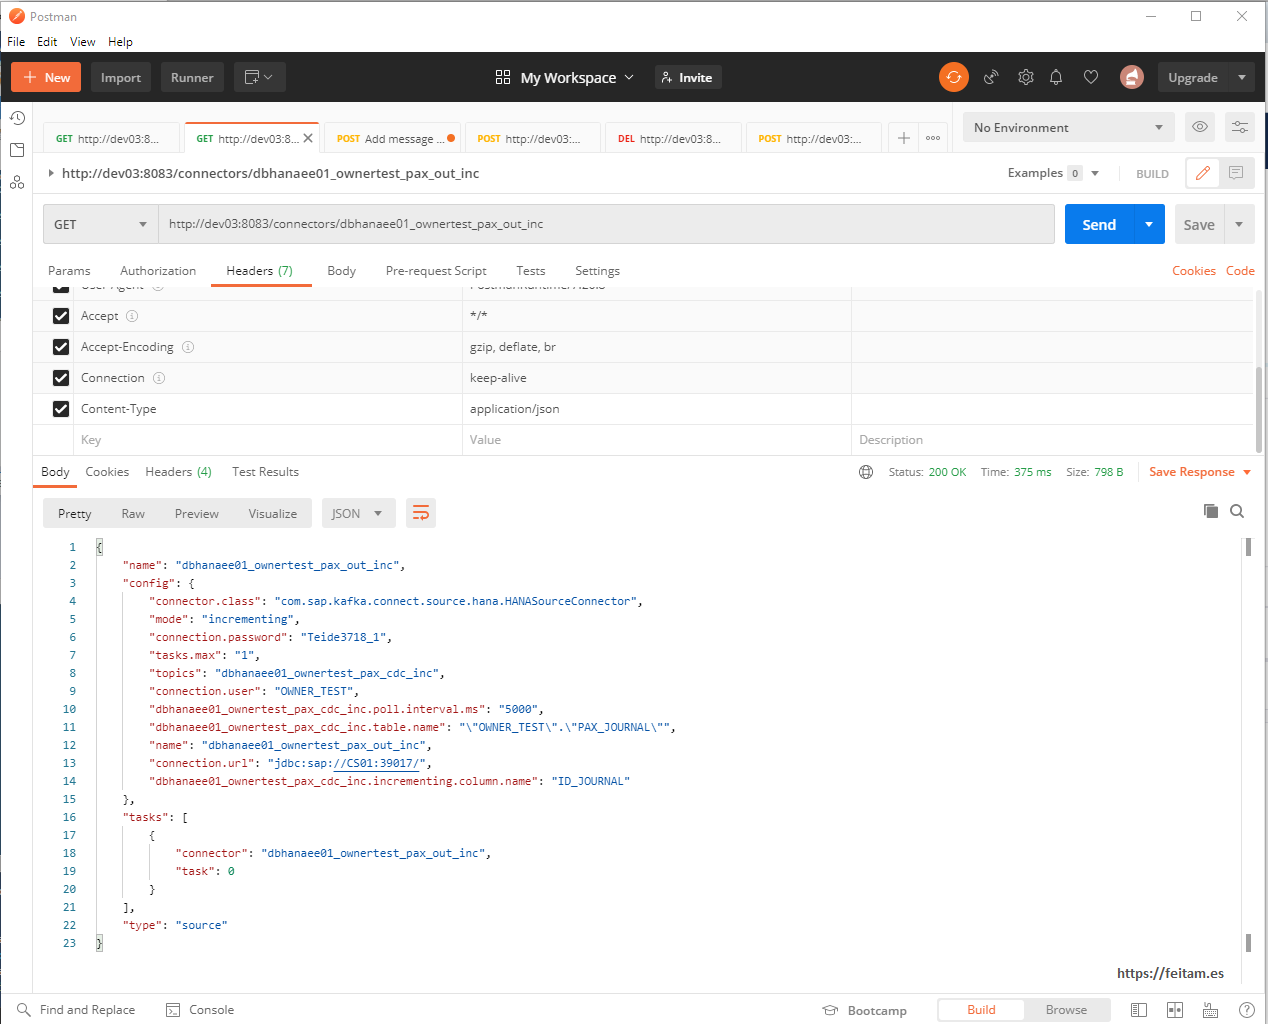
All of this can also be done by the API, for example we can see the detail of the connector instance with a GET call to the /connectors context/[connector instance name]:
And we can see the status with a GET call to http://dev03:8083/connectors/dbhanaee01_ownertest_pax_out_inc/status:
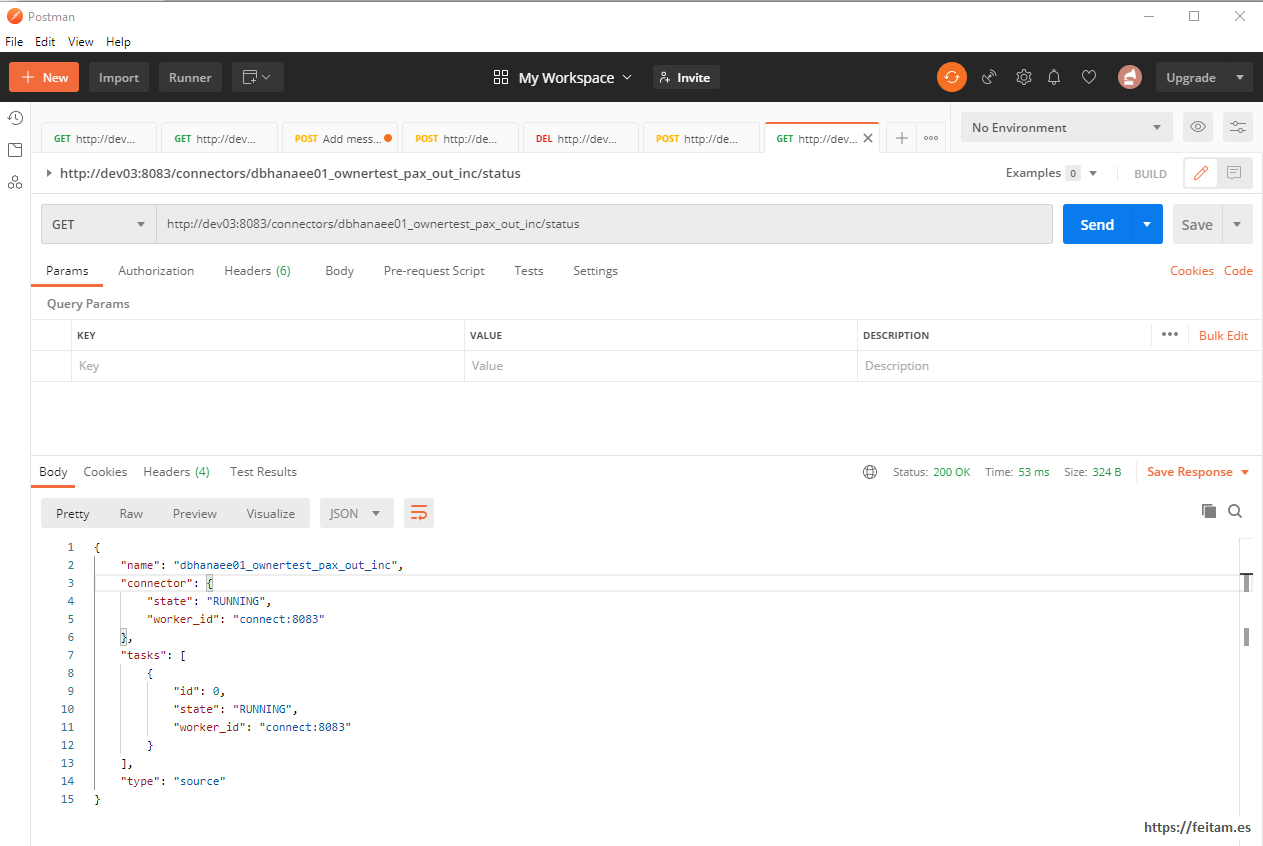
This connector instance can be stopped, restarted, and deleted from the API with PUT calls to /connectors/dbhanaee01_ownertest_pax_out_inc/pause, restart, or resume and delete. You can also manage your tasks, topics, etc. All detailed in the above-mentioned URL of this API.
The topic 'dbhanaee01_ownertest_pax_cdc_inc' specified on the connector instance is not yet created because there is no message yet. The first change to the Hana database table is released OWNER_TEST. PAX will create a new record in OWNER_TEST. PAX_JOURNAL that the connector instance will dbhanaee01_ownertest_pax_cdc_inc detect it and send the message to the topic, and in the first message it will create the topic. We run a first table log insert:
INSERT INTO OWNER_TEST.PAX(NAME) VALUES ('Mengano 1');
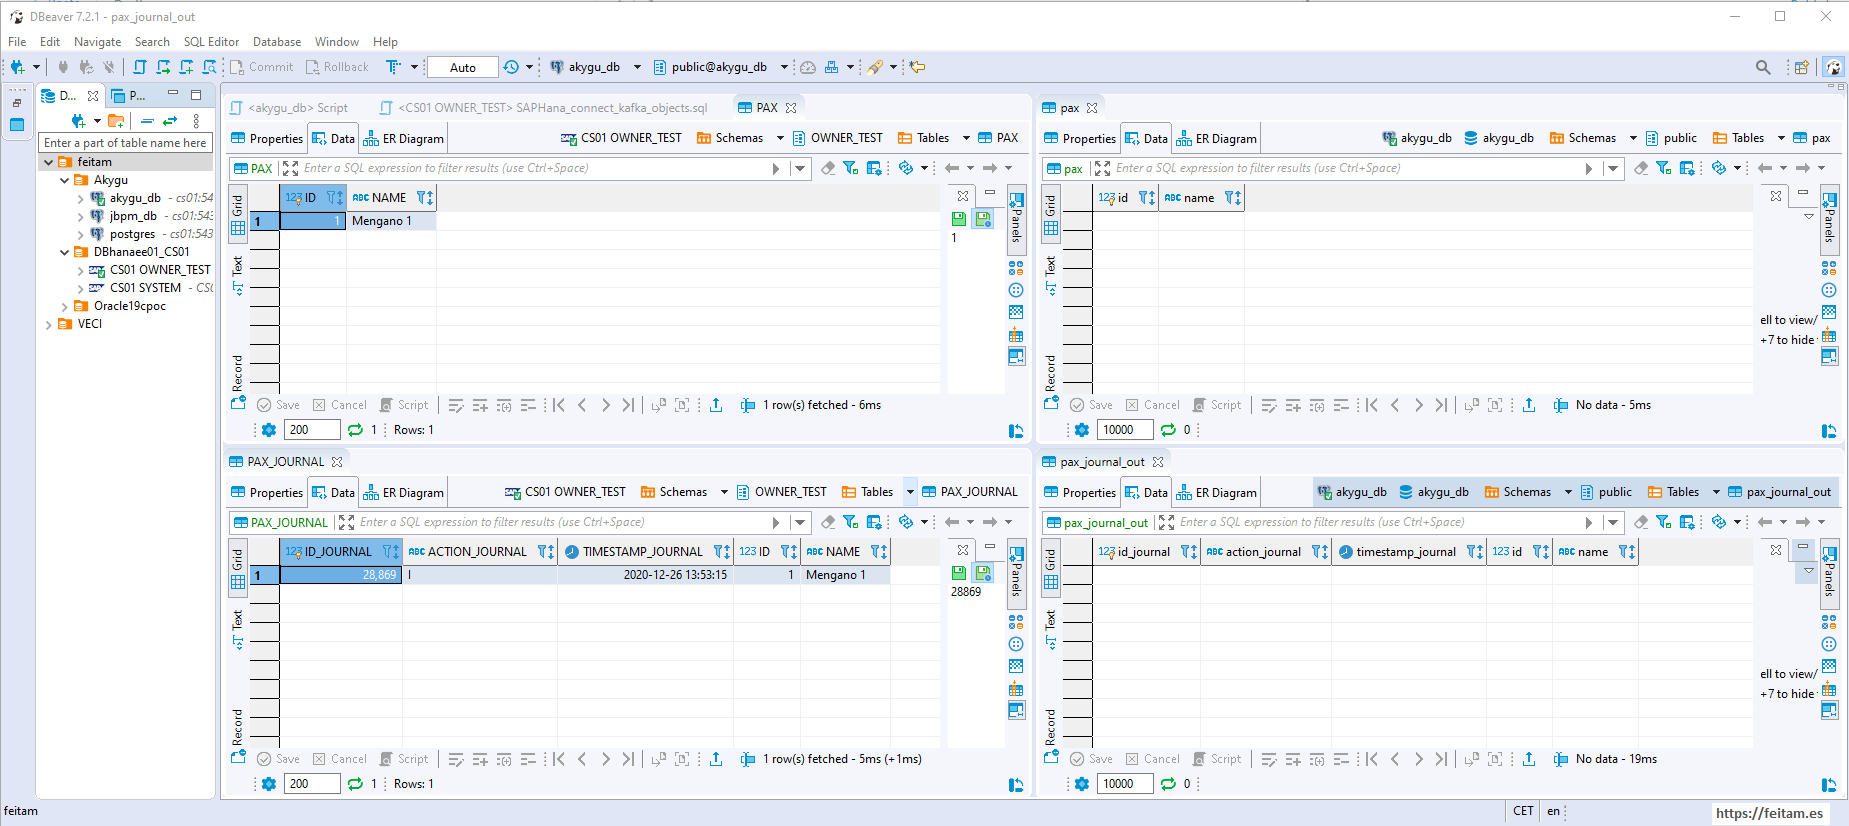
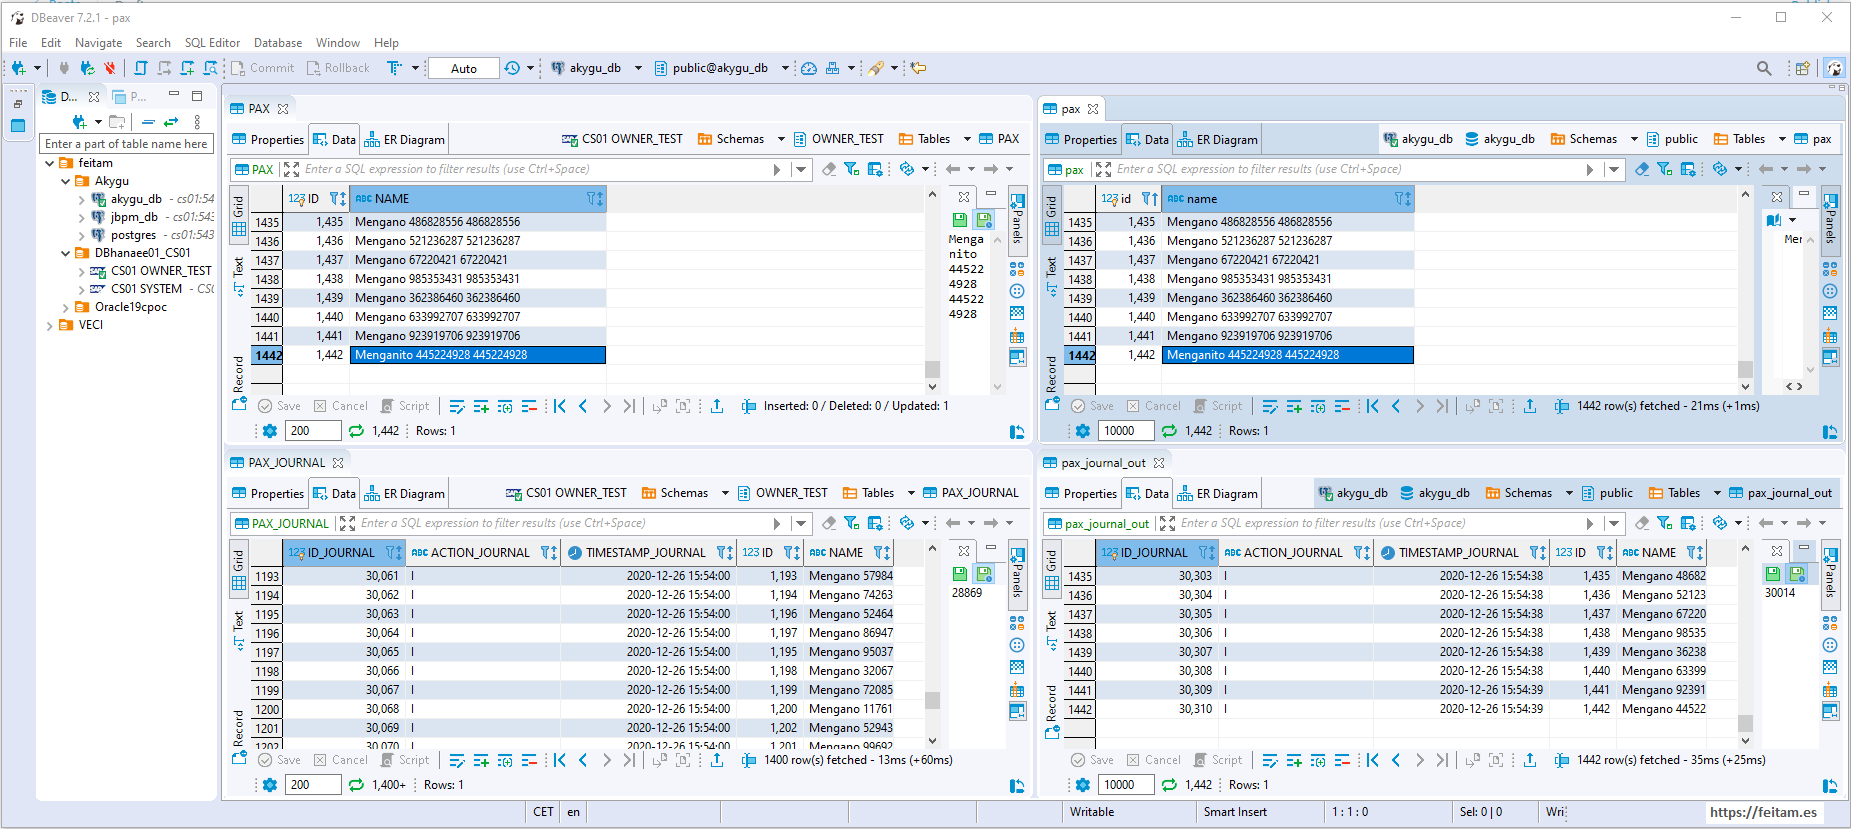
And this is the situation of the tables in both databases (Hana on the left and PostgreSQL on the right):
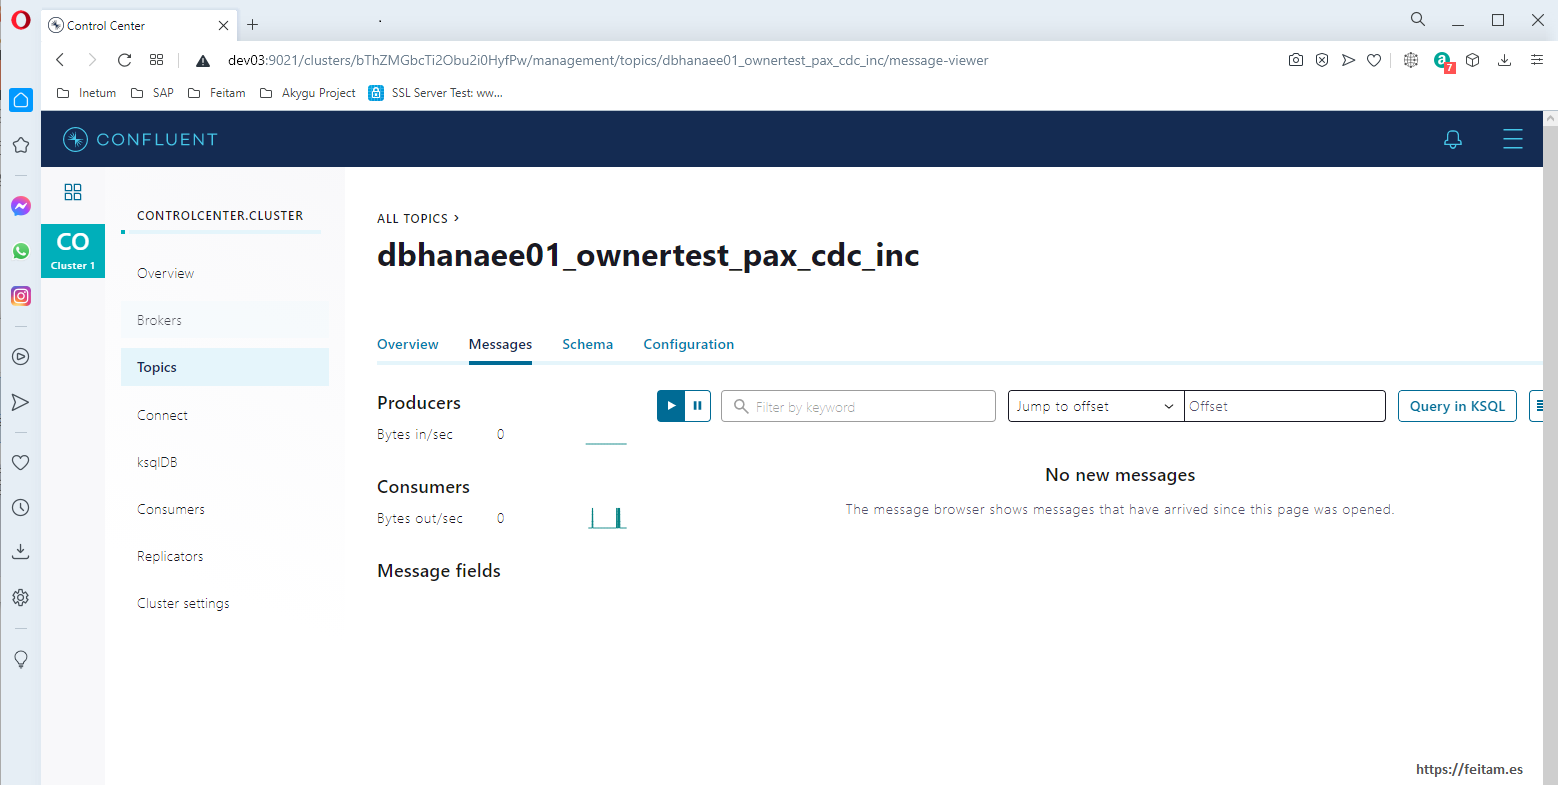
Since we haven't created the sink connector yet to send the data to PostgreSQL, PostgreSQL doesn't have the data yet. But if the topic should have been created, which we check by accessing the 'Topics' menu option in the Confluent Kafka console:
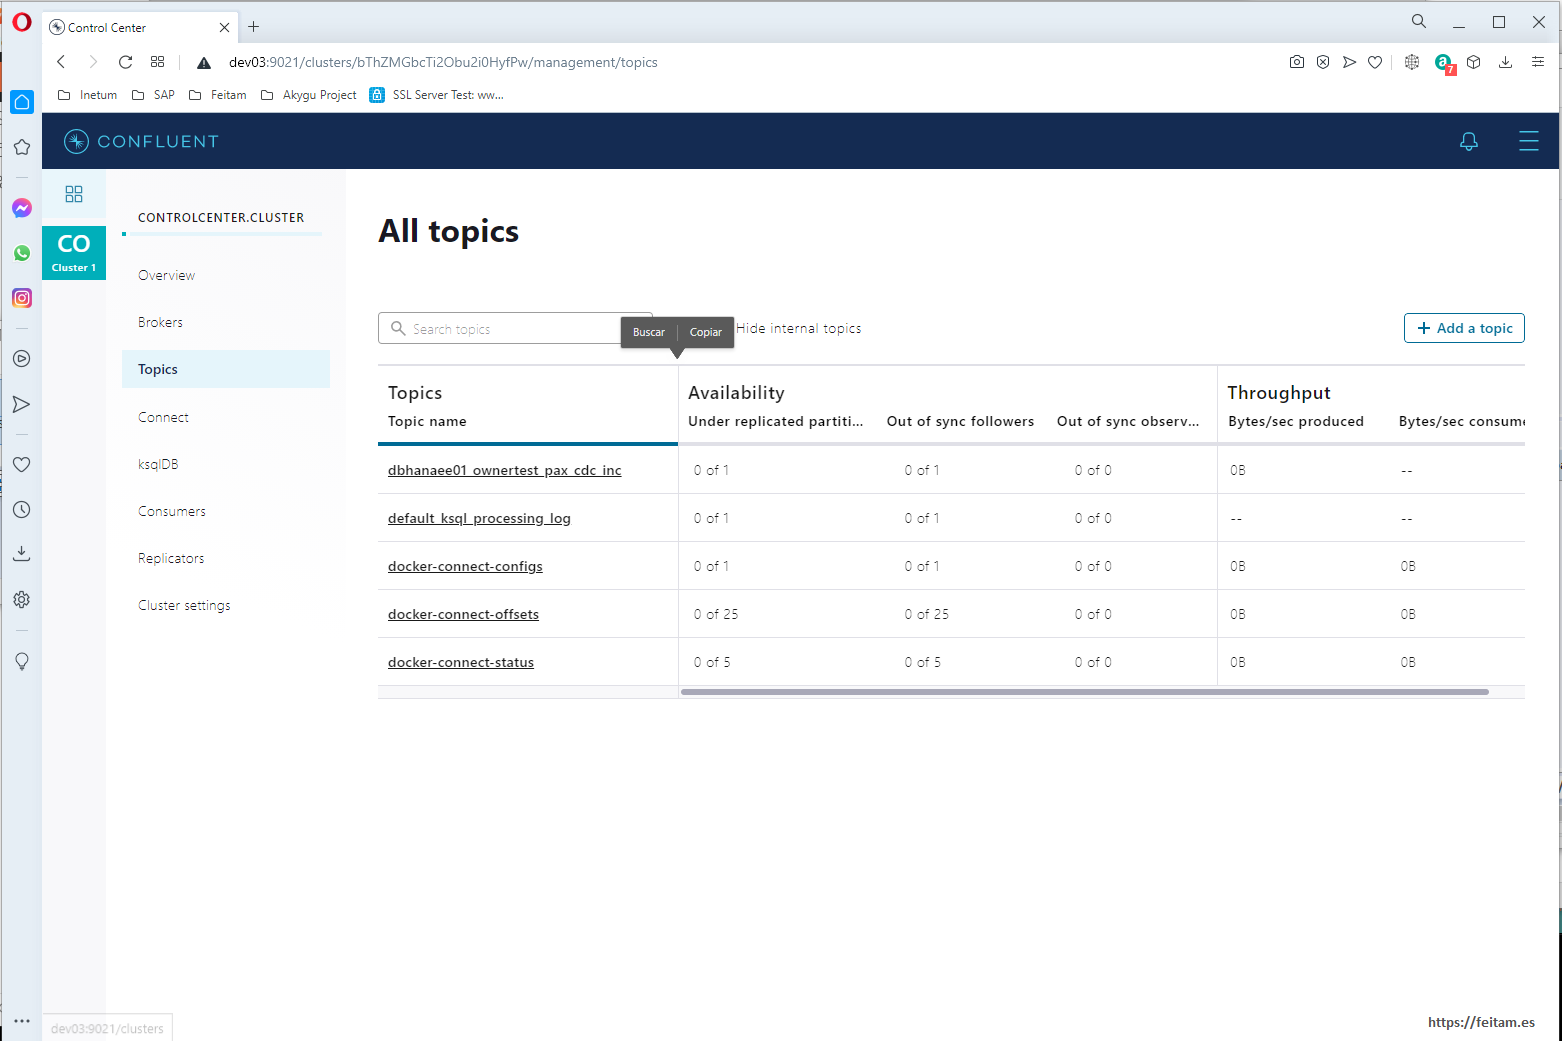
If we click on the topic we see the following:
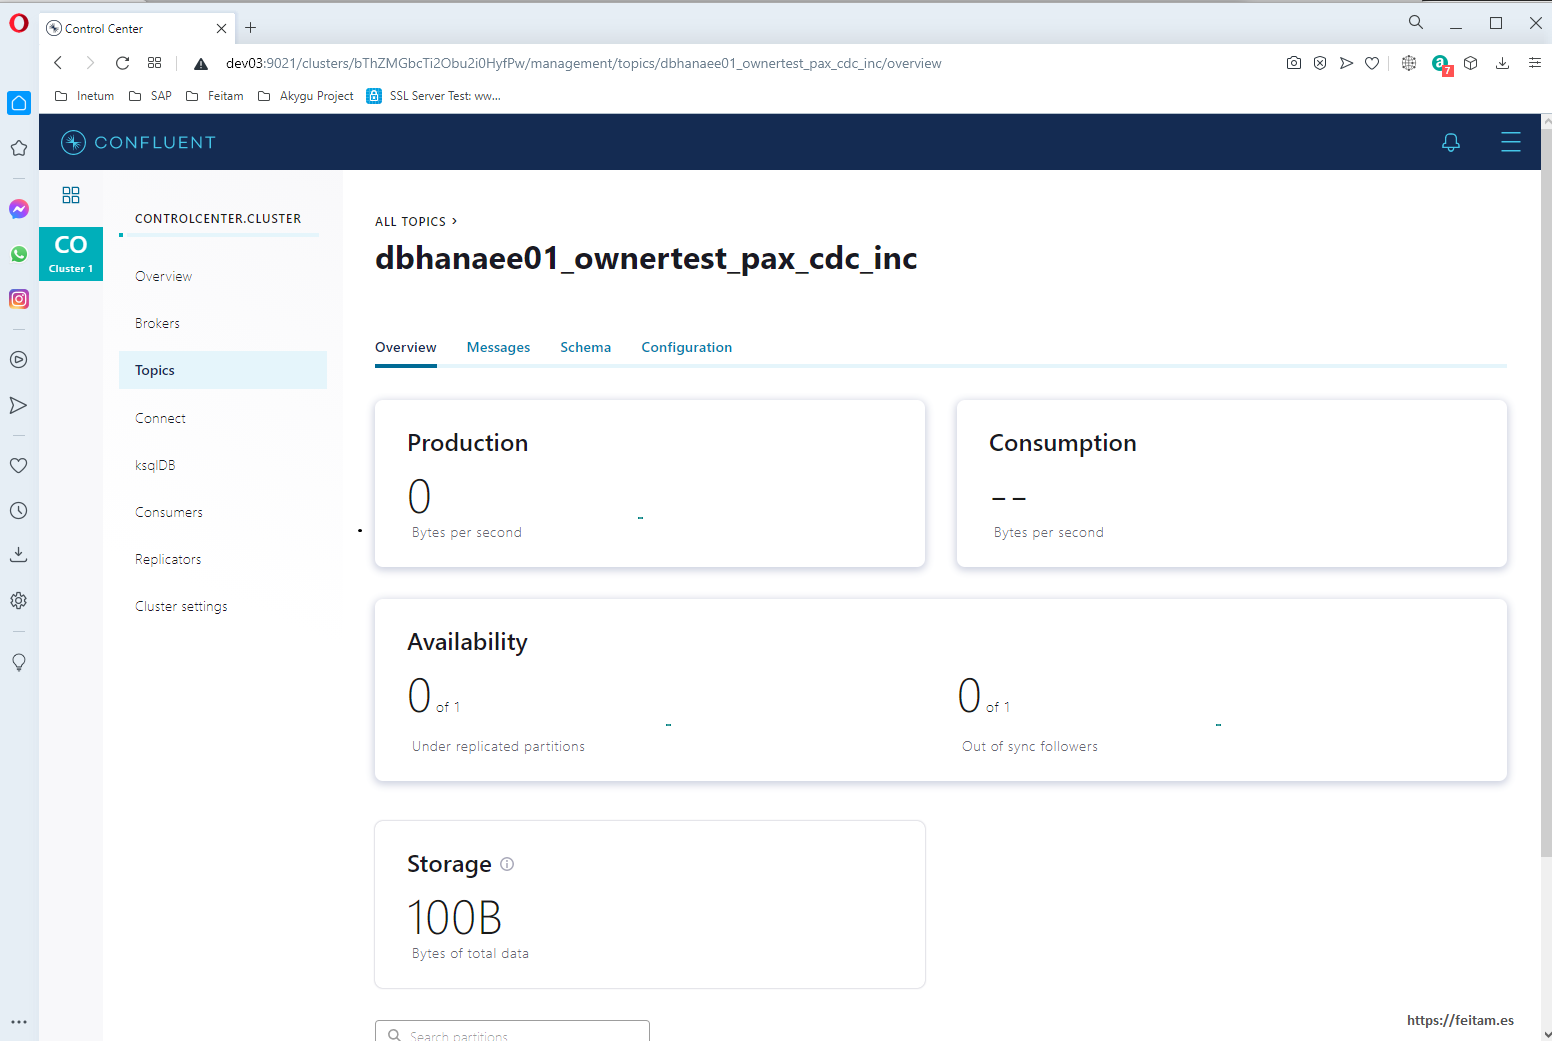
In Messages we don't see messages because this page displays only messages added to the topic while the page is on screen, it's like a consumer. If we leave this page open later when we run from Apache JMeter the load tests the messages are seen here.
And in Schema we see something very important: that an Avro schema has been created that corresponds to the structure of the table:
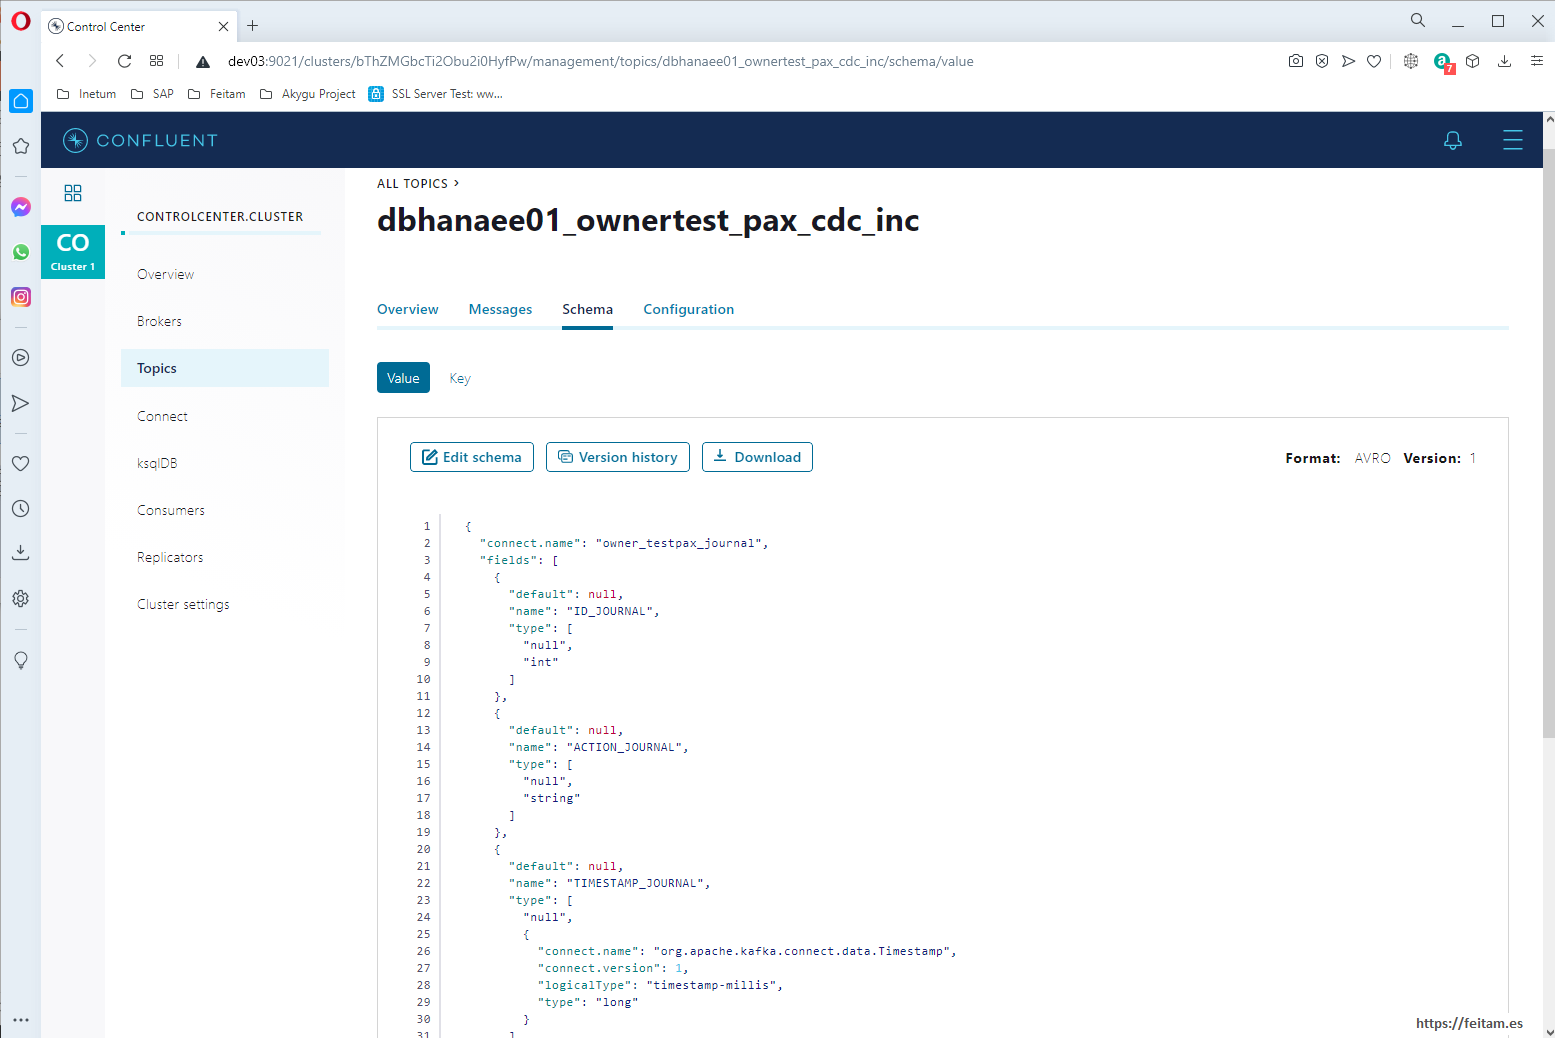
This Avro schema has been defined by the system when receiving the first message from the connector, and can be defined by us from the Enterprise Console. JSON is not XML, and one of the most sensitive aspects of JSON is that it is not typed and to solve this there are JSON schema definitions like Avro to be able to validate messages when they are received. Confluent Kafka when you have a topic with avro schema does not allow messages that do not comply with the schema, avoiding unnecessary processing on consumers. It is always recommended to use Avro for these format validations.
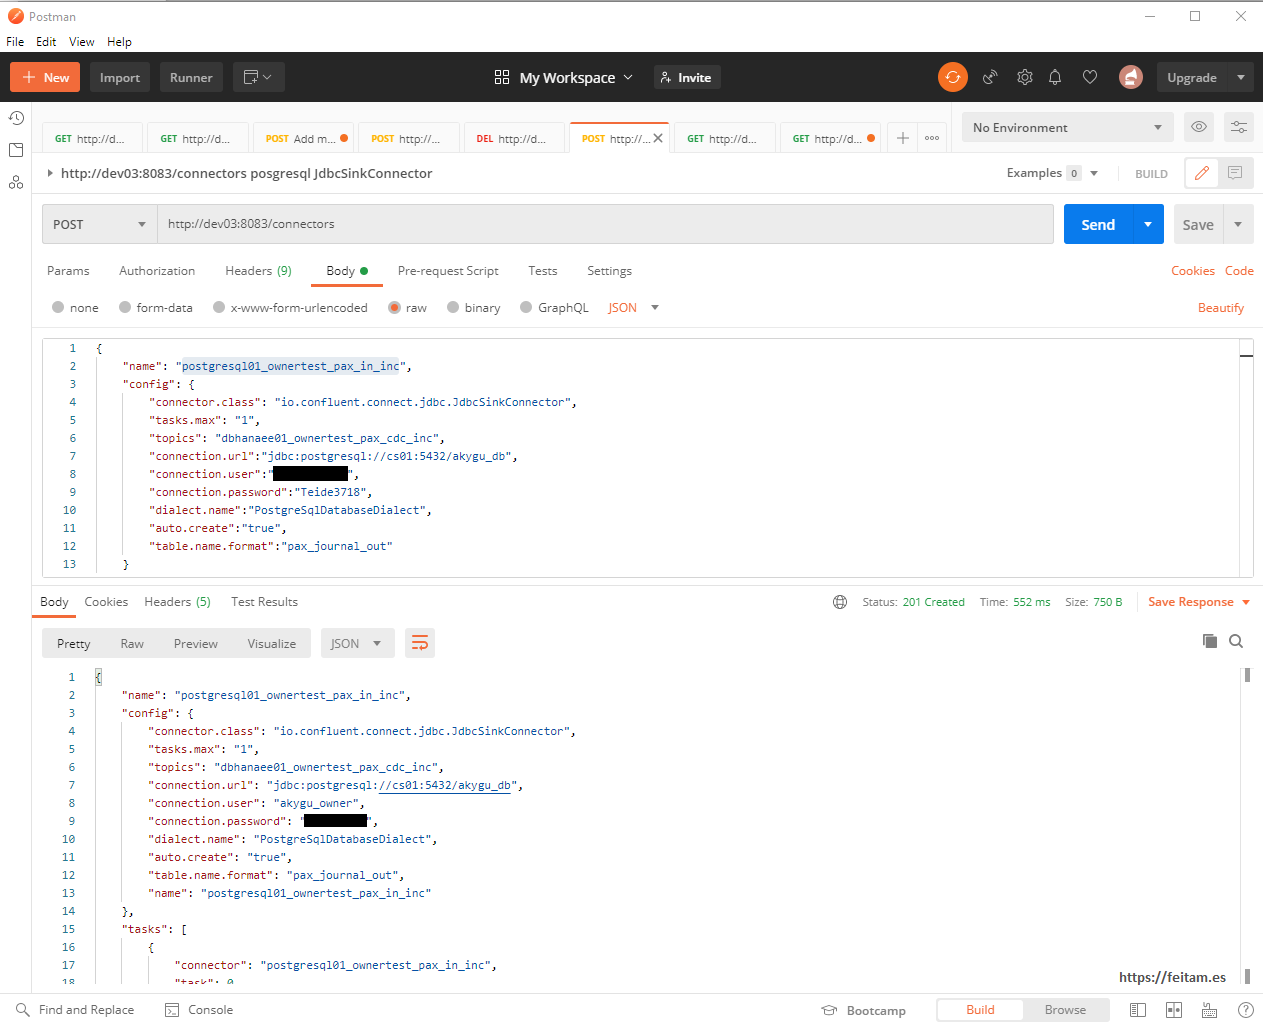
Now we create the sink category connector instance that consumes the topic 'dbhanaee01_ownertest_pax_out_inc' to log messages as logs to a PostgreSQL table to mount the CDC system. This connector instance is called 'dbhanaee01_ownertest_pax_out_inc' and this is its creation configuration JSON that will be sent in a POST call to the REST API:
{
    "name": "postgresql01_ownertest_pax_in_inc",
    "config": {
        "connector.class": "io.confluent.connect.jdbc.JdbcSinkConnector",
        "tasks.max": "1",
        "topics": "dbhanaee01_ownertest_pax_cdc_inc",
        "connection.url":"jdbc:postgresql://cs01:5432/akygu_db",
        "connection.user":"akygu_owner",
        "connection.password":"peazopassword",
        "dialect.name":"PostgreSqlDatabaseDialect",
        "auto.create":"true",
        "table.name.format":"pax_journal_out"
    }
}
It looks like the name of the connector instance, the connector class used which in this case is JdbcSinkConnector, the maximum number of tasks, the topic where messages are consumed (obviously the topic where the other connector leaves them), the PostgreSQL access data, and the table where to leave the messages.
Running in Postman gives this result:
Now we can see the two connectors:
C:\>curl -X GET -H "Content-Type: application/json" http://dev03:8083/connectors
["postgresql01_ownertest_pax_in_inc","dbhanaee01_ownertest_pax_out_inc"]
C:\>
And we can repeat the status check in console or from the REST API as we have done in the source category connector. But if we refresh the PostgreSQL database data after a second and the log that we created earlier in database Hana appears is that everything works:
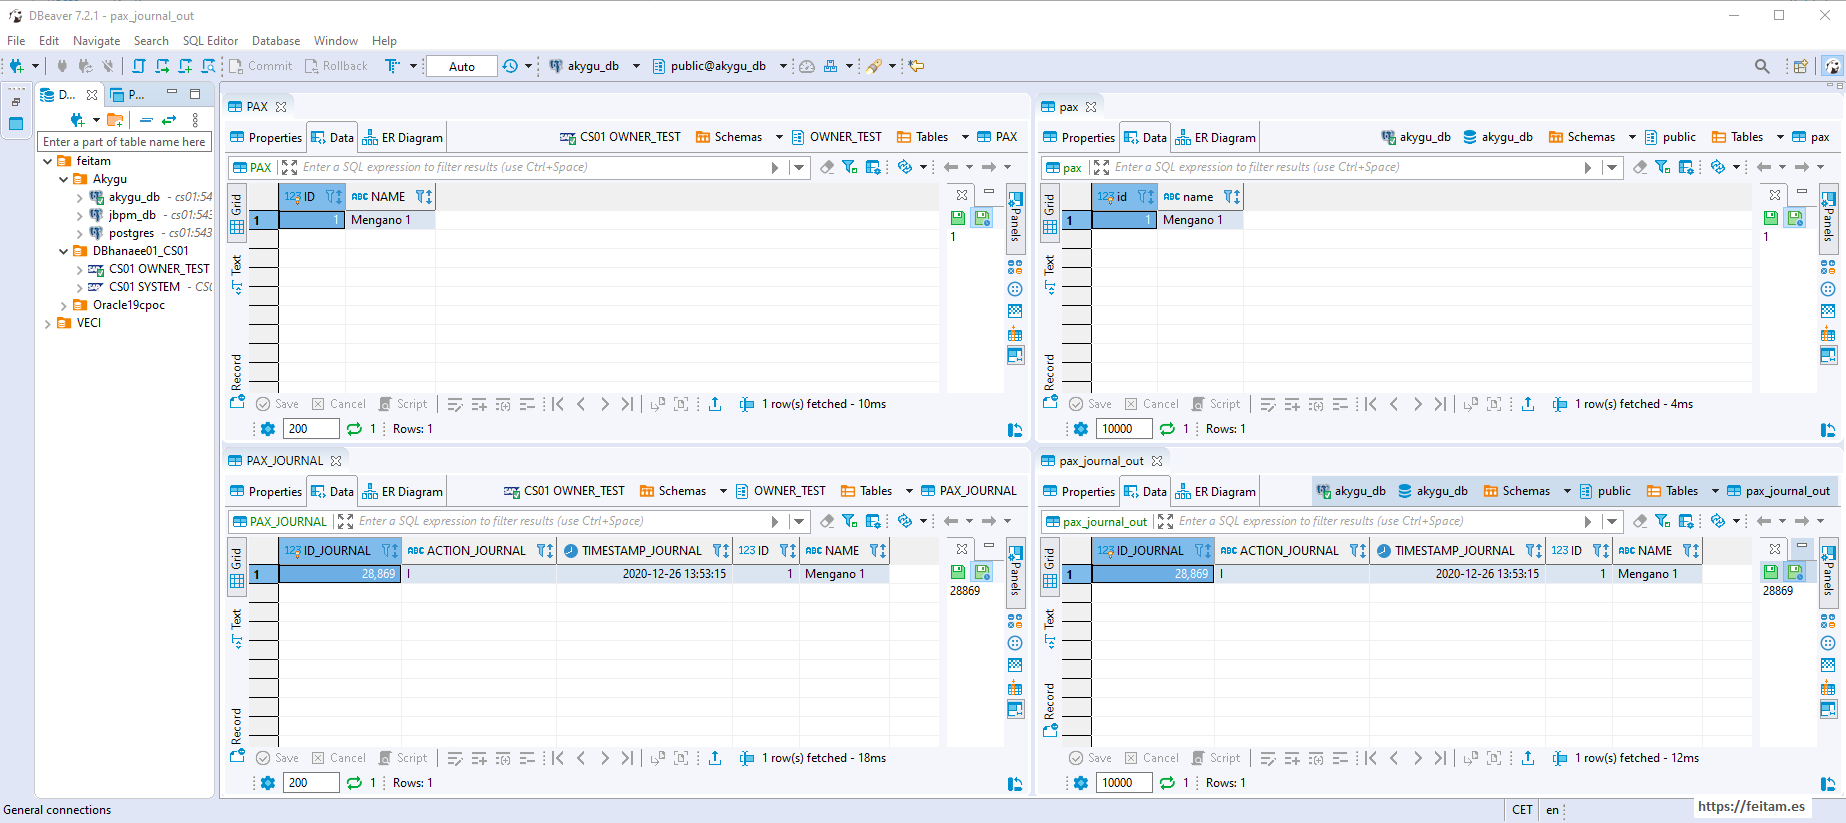
Just checking the PostgreSQL pax_journal_out tables and viewing the record that exists means that the sink connector has worked, read the topic message, and created the pax_journal_out table log, and the trigger for this table processed the log and created it in the final PostgreSQL target table named pax , and you can see in the image that it is a record identical to that of the PAX table in the Hana source database.
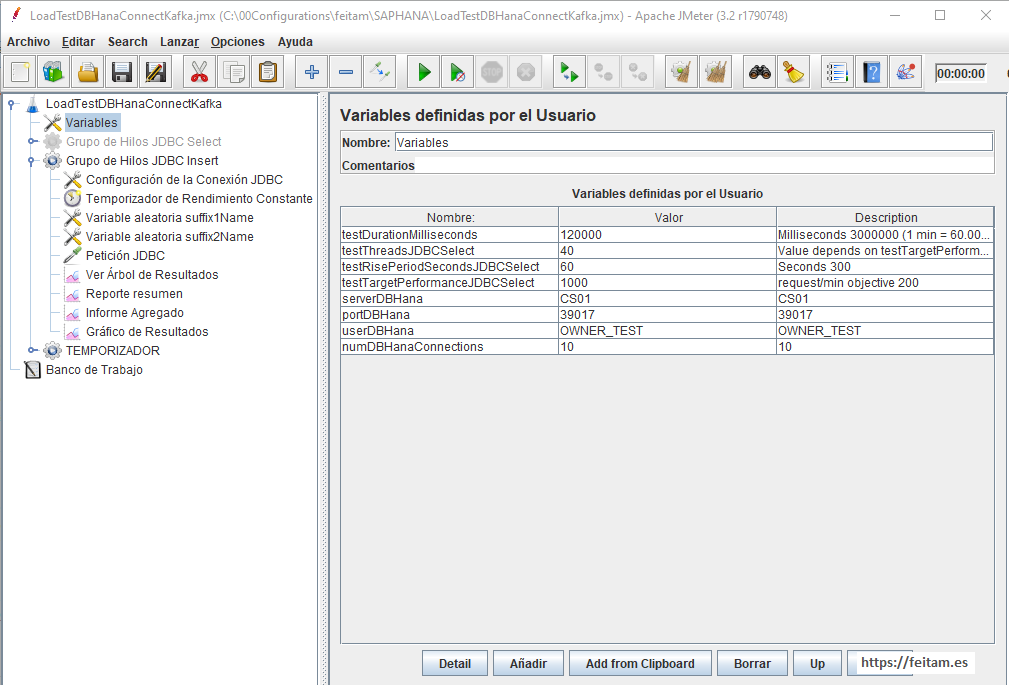
Now that we have it mounted, we're going to run an Apache JMeter from a network computer that will connect to the Hana database and create table ONWER_TEST. PAX with a load of 1000 insert/minute with 40 threads and a duration of two minutes and an upload period of 60 seconds:
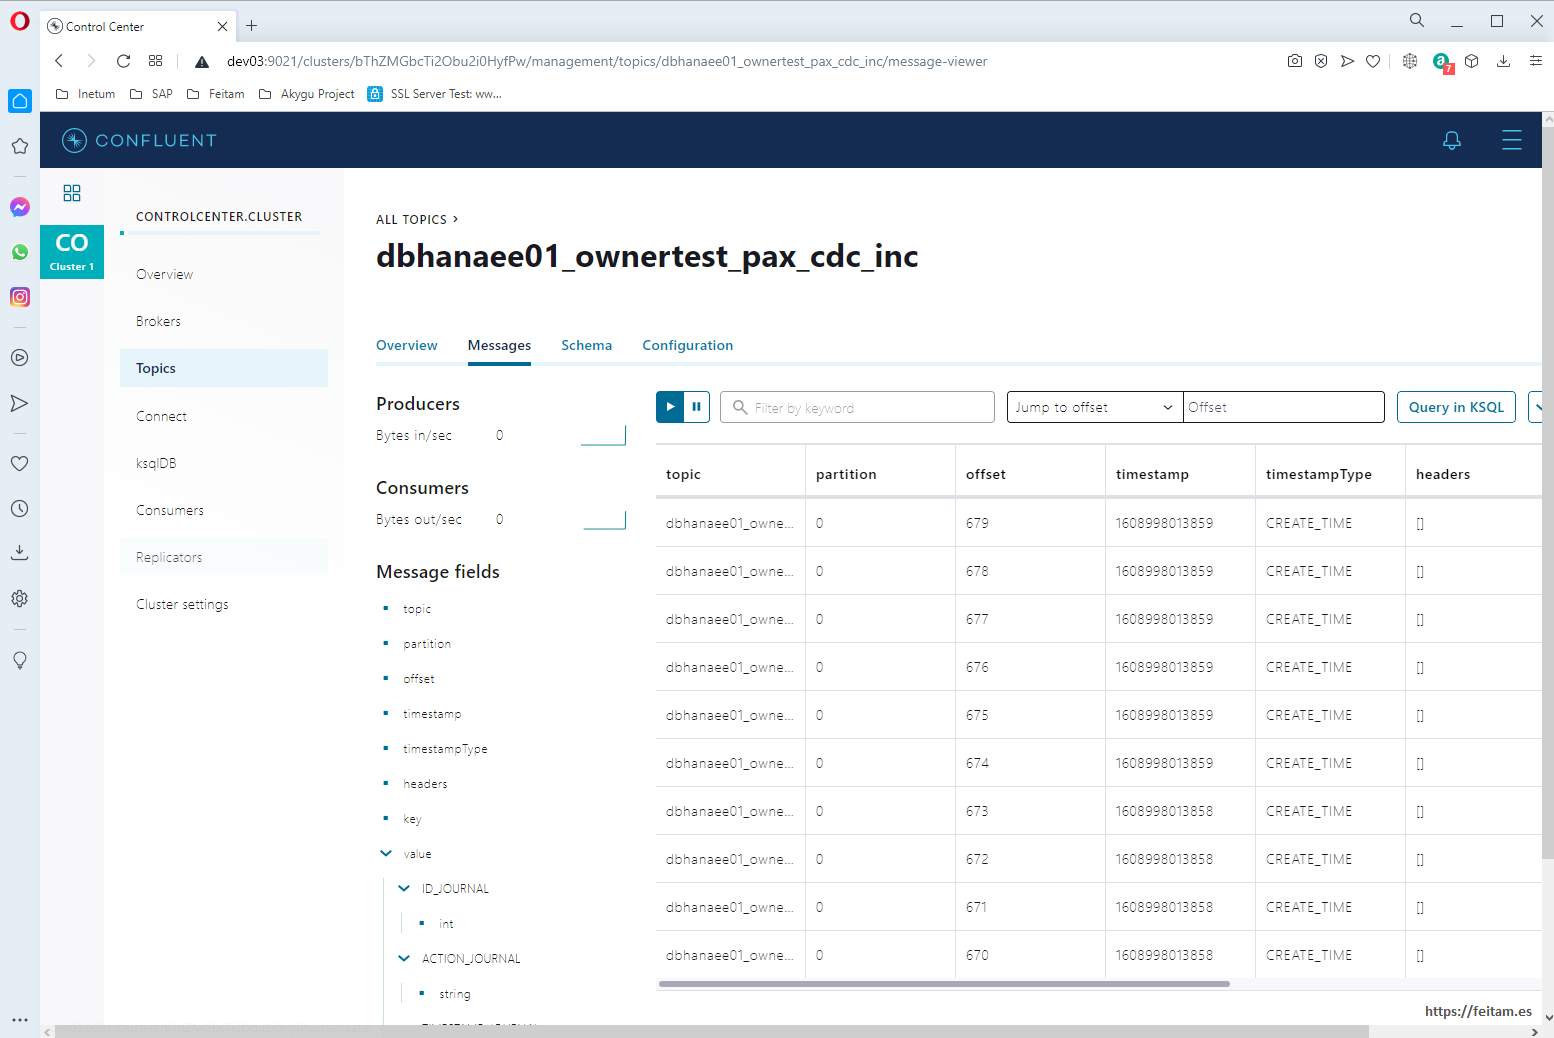
Before running we will leave the topic 'dbhanaee01_ownertest_pax_cdc_inc' page open in the console in the Messages option to verify that we see the messages here:
And we will also create a consumer with the command (it is required to have Confluent installed, which in my case I have installed on the dev03 server) kafka-avro-console-consumer from Confluent. It is important to note that since I am calling the broker and schema-registry from outside docker-compose I cannot use their server names for each container, and I use the server name dev03:
kafka-avro-console-consumer --bootstrap-server dev03:9092 --from-beginning --topic dbhanaee01_ownertest_pax_cdc_inc --property print.key=true --property schema.registry.url=http://dev03:8081
In this way we will see that there are two consumers of the topic 'dbhanaee01_ownertest_pax_cdc_inc':
* Installing sink category connector that takes messages to the PostgreSQL database as logs
* The consumer created with the kafka-avro-console-consumer command
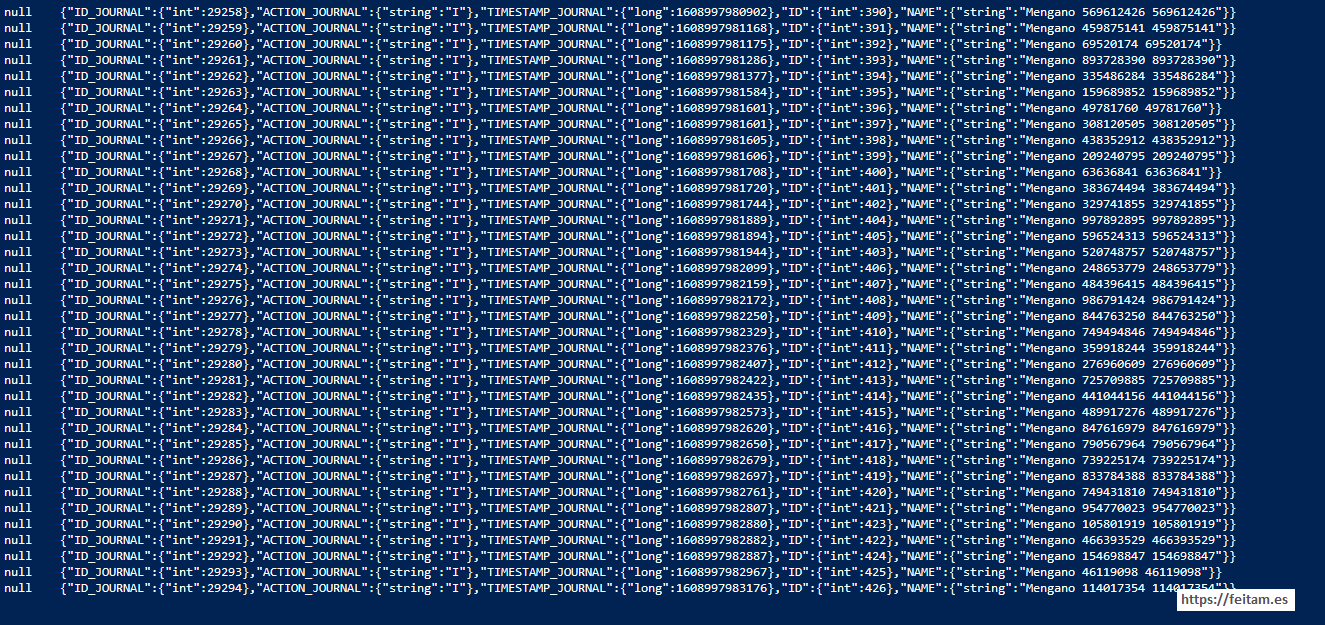
As just running the consumer with kafka-avro-console-consumer I see the first record:

We launched Apache JMeter and started to see which previous consumer already has more records:
And on the Enterprise Console:
Apache JMeter has ended up creating 1441 records that appear in both tables:
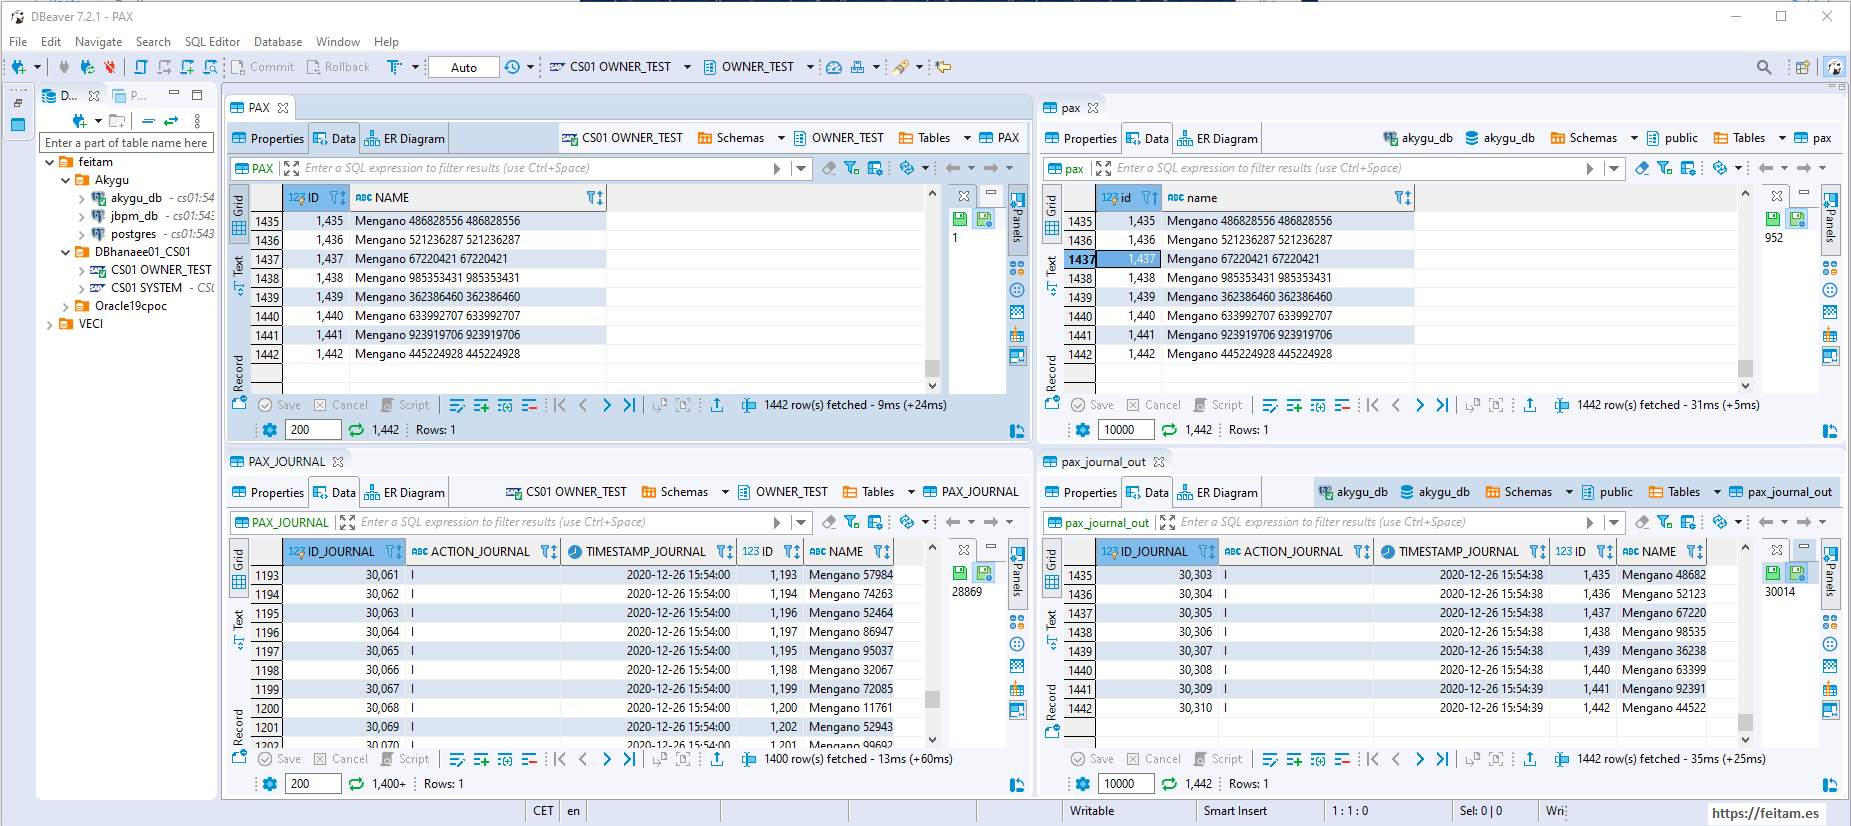
The change of information is not immediate, as the source table is checked every 5 seconds as specified, but this handover of 1441 records has been done almost immediately. The JDBC sink connector has parameters that we have not configured leaving default values for the number of retries, the maximum number of records to process in each cycle, and so on.
To see the rate of change we can change the last record the value of the NAME field and see how long it takes to display in PostgreSQL:
In my case it took 5 seconds, which is logical, because source connector cycles every 5 seconds.
If we see consumers in the Enterprise console, both consumers appear:
In another post on my blog I will make another CDC integration with the kafka-connect-sap connector but in 'bulk' mode, which does not take all the data from the table and does not require column to manage self-incremental management.
There is one important aspect: the triggers in the OWNER_TEST. PAX deletes the records from the OWNER_TEST. PAX_JOURNAL with an antique greater than 4 days. In this way the system is self-commanded only needing almancenamineto in OWNER_TEST. PAX_JOURNAL for an average transaction volume of 4 days. Just as persistence has been left in topic 'dbhanaee01_ownertest_pax_out_inc' in 4 days for them to be on par, and it must have a sizing for 4 days of transactions. This means that in the event of a system failure it is necessary to recover it before those 4 days so as not to lose changes. A four-day SLA in one incident is a very large and generally approachable SLA.
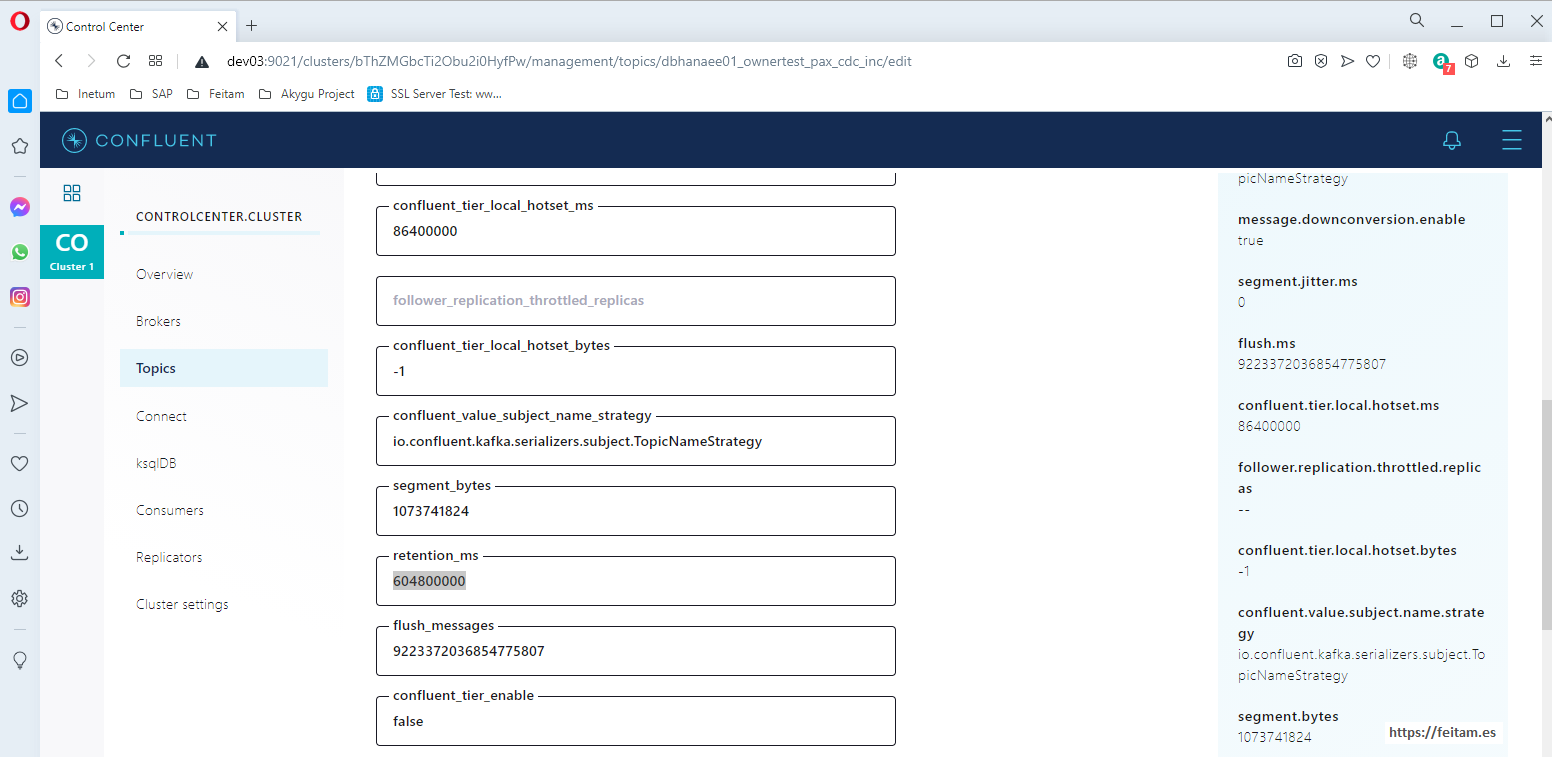
To change the persistence duration of messages in topic 'dbhanaee01_ownertest_pax_out_inc' you can access it from the Enterprise Console in Topic, press the topic and then on 'Settings' press the 'Edit setting' button to change the value of 'retention_ms':
This integration through kafka of two different databases, leaves them completely decoupled, being able to be working and the other falling without always there are problems within the range of 4 days that would support the persistence of kafka.
Kafka allows you to manage these connectors for point-in-time needs. For example, increase the tasks of one or more connectors if we have a significant bulk load of the OWNER_TEST. PAX with many transations. Or if we have it in Confluent Kafka dockerized with docker-compose or kubernetes we can manage more replicas (taking into account the operating logic of the topics, their consumers, offset, etc.), allocate more memories or CPUs as needed. We already know that connectors can be paused and restarted when required through the Enterprise Console or API. And you may consider that in the event of a bulk load, incremental loading is stopped and the kafka-connect-sap connector is raised in bulk mode until both tables are aligned after bulk loading and switch to incremental mode.